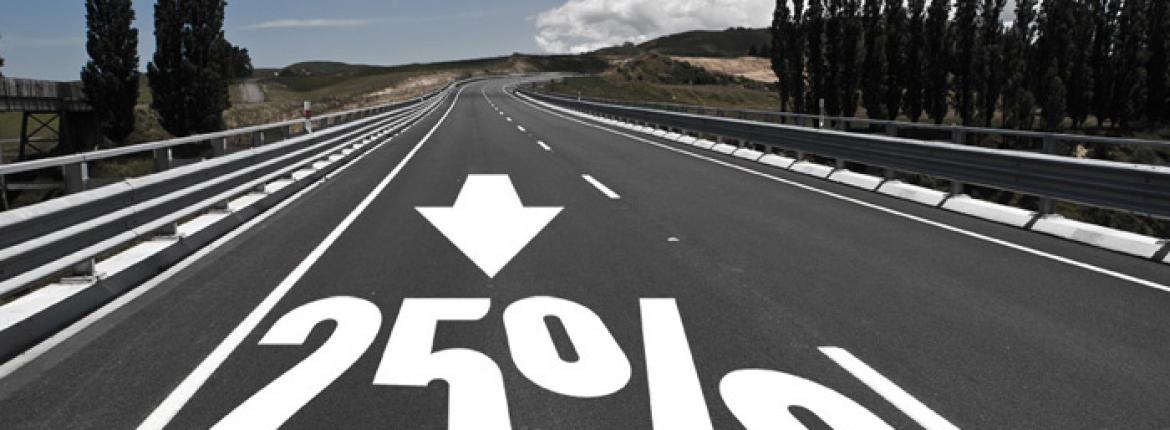
At press time, detailed figures for New Zealand were only available for the first three-quarters of 2011 but, because the reduction lasted all year, these still provide a good picture of what happened.
One explanation might be that fewer people drove in 2011, but the evidence doesn’t support that theory. While petrol consumption was down 40 million litres, that’s less than a 2% drop in the bucket compared to the last four years’ average. Similar percentage reductions in fuel consumption in other years haven’t produced such a reduction in fatalities.
To get a better understanding of the situation, we read through 165 crash reports, accounting for 177 deaths, to see what was different about 2011.
What stood out immediately was the huge reduction in fatal crashes in the far North and Whangarei, South Auckland, Rotorua, Whakatane, Gisborne, Whanganui, Nelson and Tasman, and Southland. Police data shows drink-driving conviction rates in these areas also dropped by around 20%.
Police general crime data to June 2011 shows that drug offences nationwide were down by the same proportion. It’s possible that the cost of living has cut into alcohol and drug budgets. It must also be noted that fatalities following Police pursuits were down from 17 in 2010 to five in 2011.
In 2011, Maori fatalities almost halved. There are typically two kinds of crash where Maori are over-represented – youth speed and alcohol crashes (partly because Maori youth form a higher proportion of the youth population), and crashes involving older people driving long distances and becoming fatigued. In many of these cases simply wearing a seatbelt is the difference between life and death and, while fatalities were down, serious injury and minor injury crashes were about the same as previous years.
Most of the major cities (except Christchurch) had similar crash rates to previous years. In Christchurch, during the earthquake year, drink-driving increased and so did fatal crashes. One ethnic group affected by the earthquakes saw a significant road fatality reduction – Asian students. Most Asian fatal crashes involve students, often with a young person driving a powerful car at night, or a fatigued young person driving visiting older family members. Both were reduced and Asian deaths were down from an average of about 17 to four. Serious and minor rates were also down.
Another community happily conspicuous by their absence last year was motorcyclists. Motorcycling deaths were half previous rates, accounting for another quarter of the reduction. Injuries were also slightly reduced. Generally, motorcycling deaths are speed-related and they still occured, but multiple fatal accidents, where a group of riders is involved, were absent in 2011.
Perhaps the most interesting reduction was fatalities among teenage males, which halved last year.
Serious and minor crashes were also down and so too was teen licensing. Exactly why is not yet clear. Part of the reason may be tougher licence tests, but another theory is that the internet is replacing the car as the space young people use to court one another. This has certainly been noted overseas.
So, the big question of 2011’s fatality drop is not so much ‘why’ as ‘why now?’ The previous largest drop in the road toll was during 1973-74, which corresponded with the oil crisis and the reduction of open road speeds to 80km/h. Those savings in lives lost persisted, as people became more conservative about the way they drove until vehicle technology caught up. Perhaps this conservatism is what’s happening now as well.
Another possibility is that people can’t afford to give up their cars but, when times are tough, something has to give – and its alcohol and drugs. This untested theory might account for why, during most of the year, the road toll was down but over Christmas and New Year, despite Police reducing speed tolerance thresholds, the toll rose.
Perhaps the most vexing problem for safety agencies is that we have experienced this substantial improvement in statistics even though budgets have tightened. This is not to question the role of Government agencies in road safety – clearly over time they do make a difference. But, this result makes arguments for more resources tricky.
Ultimately, what 2011 showed was that New Zealand motorists can, collectively, make more difference to road safety results than any Government effort can. Ensuring that we keep making a difference is the ongoing challenge for all of us.
Reported by Peter King for our AA Directions Winter 2012 issue


