For each mode, we asked AA Members how satisfied they were with the enjoyment of their trips.
29 July 2025
AA Local Transport Survey 2025 results
Insights from AA Members on local car, cycling, and walking trips
Each year, the AA surveys its Members about their experiences with local transport - including car travel, walking, cycling, buses, and trains. These insights can help identify road safety and infrastructure issues that road controlling authorities across New Zealand can address, ultimately improving safety and quality of life for both AA Members and the wider public.
This page provides key highlights of the experiences of 7,568 AA Members who completed the AA's Local Transport Survey in 2025.
The AA's 2025 Local Transport Survey covers:
- How many Members had used local transport modes in the past four weeks; including driving, as a passenger, public transport, cycling, and walking.
- If they had changed their transport use in the past year, and why.
- How satisfied Members are with each transport mode, including road safety design, surface conditions, and overall experience.
- Where Members believe local transport investment should be focused.
- Local transport infrastructure changes that improved their quality of life in the past 12 months.
Note: Car travel, walking, and cycling are common across all districts, so detailed results for these modes are presented here. Summary information on public transport is included, with more detailed public transport findings to be reported separately.
Key findings
AA Local transport Survey 2025 results
Driving is the main way AA Members get around
Nearly all Members (97%) drove in their local area in the past four weeks, and 60% travelled as passengers. Walking is also common, with 60% of Members walking locally, especially in Wellington, Otago, and Nelson. Public transport use is highest in Wellington, while cycling is most popular in Canterbury, Marlborough, and Nelson.
Less than half of AA Members enjoy travelling by car - up to three-quarters enjoy sustainable transport modes
Only 4 out 10 Members enjoyed car trips. In contrast, over half enjoyed sustainable modes, particularly the train (76%). This was followed by cycling (69%), walking (65%), and bus trips (64%).
Satisfaction is highest for alternative modes where infrastructure is well designed
Members report high enjoyment of alternative modes, particularly in regions with better infrastructure. Satisfaction with cycling and walking is strongest where routes are direct, safe, and separated from traffic. However, satisfaction drops when infrastructure is poorly designed or shared with other modes.
Road condition is one of the biggest concerns for drivers
More than half of Members (54%) are dissatisfied with the condition of local roads, especially in Northland, the Wairarapa, South Canterbury, and North Otago. Other drivers’ behaviour and road design for safety are also common concerns. Parking satisfaction varies widely, with urban areas showing more frustration.
Other drivers' behaviour is a concern for car trips
Over half of Members were dissatisfied with other drivers' behaviour., with dissatisfaction highest in Whanganui, Auckland and South Canterbury. Aggressive driving and a lack of rule-following were cited by many Members as concerns.
Most AA Members feel drivers are prioritised, but want more balance
Over half of Members (54%) believe drivers are currently prioritised for transport improvements. However, many want to see more investment in public transport (43%) and cycling infrastructure (26%). Members want funding for roads and public transport protected from budget cuts.
Few AA Members have noticed recent improvements
Six out of ten Members (61%) say no recent transport infrastructure changes have improved their daily life. Where improvements were noticed, they were most often due to improved or new roads, tunnels or bridges (25%), new or improved cycling infrastructure (16%), and new or improved local walkways (15%),.
Accessibility is a challenge for pedestrians
Only 23% of Members are satisfied with accessibility for disabled and elderly people. Satisfaction is highest in South Canterbury, the Wairarapa, and Hawke's Bay, but lowest in Northland, Auckland, and Wellington.
Regional differences are significant
Dissatisfaction with road condition and congestion is highest in Northland and Auckland, while satisfaction with walking and cycling is highest in regions with dedicated infrastructure.
Infographic: Insights from the AA Local Transport Survey 2025
How do AA Members travel locally?
Driving dominates, but sustainable transport plays a role
We asked AA Members what types of transport they had used locally in the past 4 weeks. We found that nearly all Members had driven locally, but alternative transport use such as walking and cycling also play key roles in how they get around.
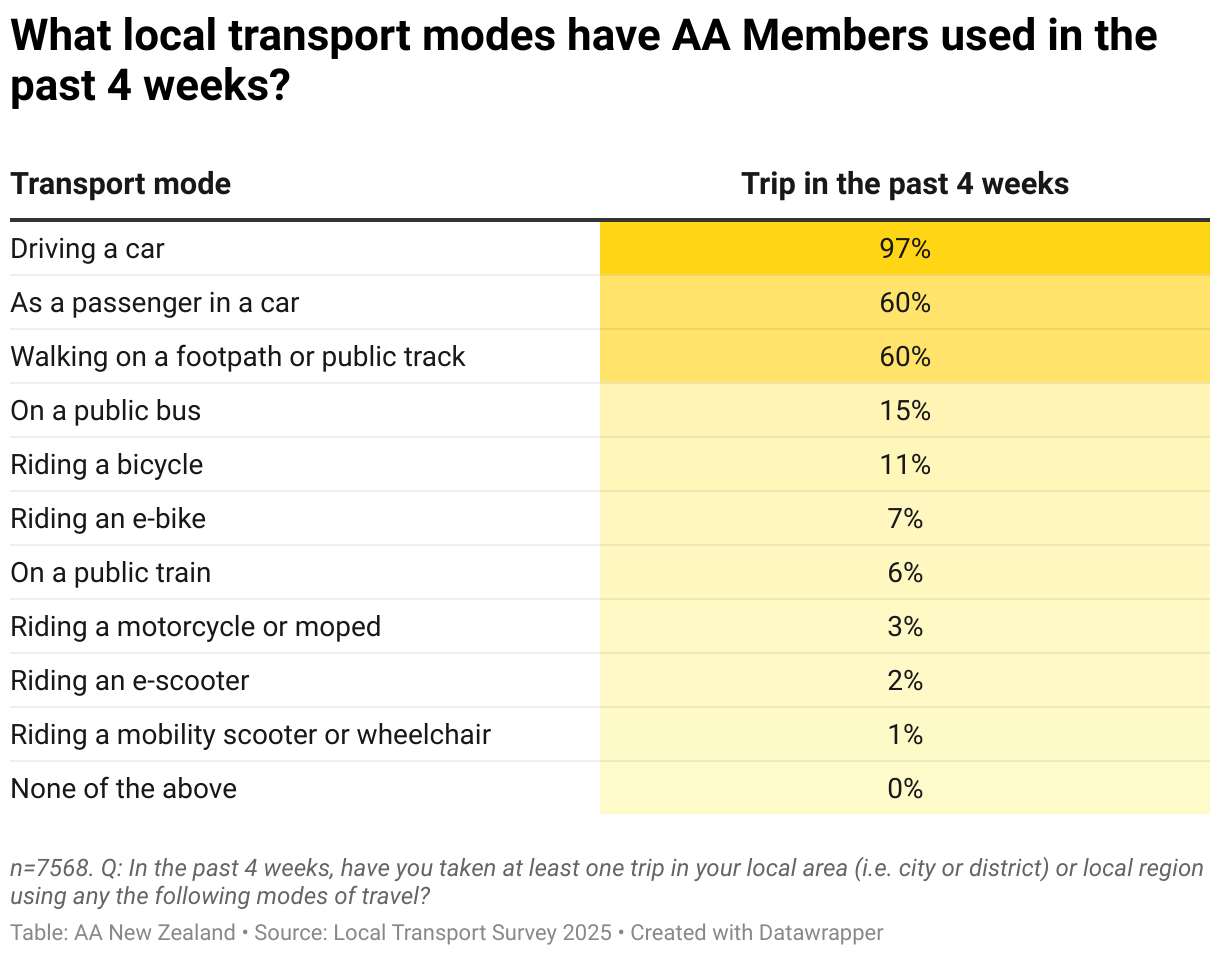
Members use a wide range of local transport options, with strong regional differences reflecting infrastructure and accessibility.
- Nearly all Members (97%) drove in the past 4 weeks. This was highest in South Canterbury, at 98%.
- 6 out of 10 (60%) took a local trip walking on a public footpath or track. Walking is most common in Wellington (70%), Otago (68%), and Nelson (67%).
- 1 in 7 (15%) caught a bus. Bus use is highest in Wellington (37%), followed by Auckland (27%).
- 1 out of 7 (15%) in total cycled locally, using an e-bike or a bike. 7% overall took at least one trip on an e-bike, and 9% on a bike. Cycling is highest in Canterbury and Marlborough (16–17%). E-bike use is highest in Nelson (15%).
- About 1 in 20 Members (7%) caught a train in the past 4 weeks. Train use is highest in Wellington (25%) and the Wairarapa (22%), reflecting strong rail infrastructure.
- 3% drove a motorcycle or a moped. Motorcycle/moped use is slightly higher in the Wairarapa (7%), and Marlborough (6%).
- 2% rode an e-scooter, with highest usage in the Wairarapa and Canterbury (4%).
- 1% rode a mobility scooter or wheelchair, with the highest rates in Northland and Taranaki (both 2%).
Car trips are the least enjoyable
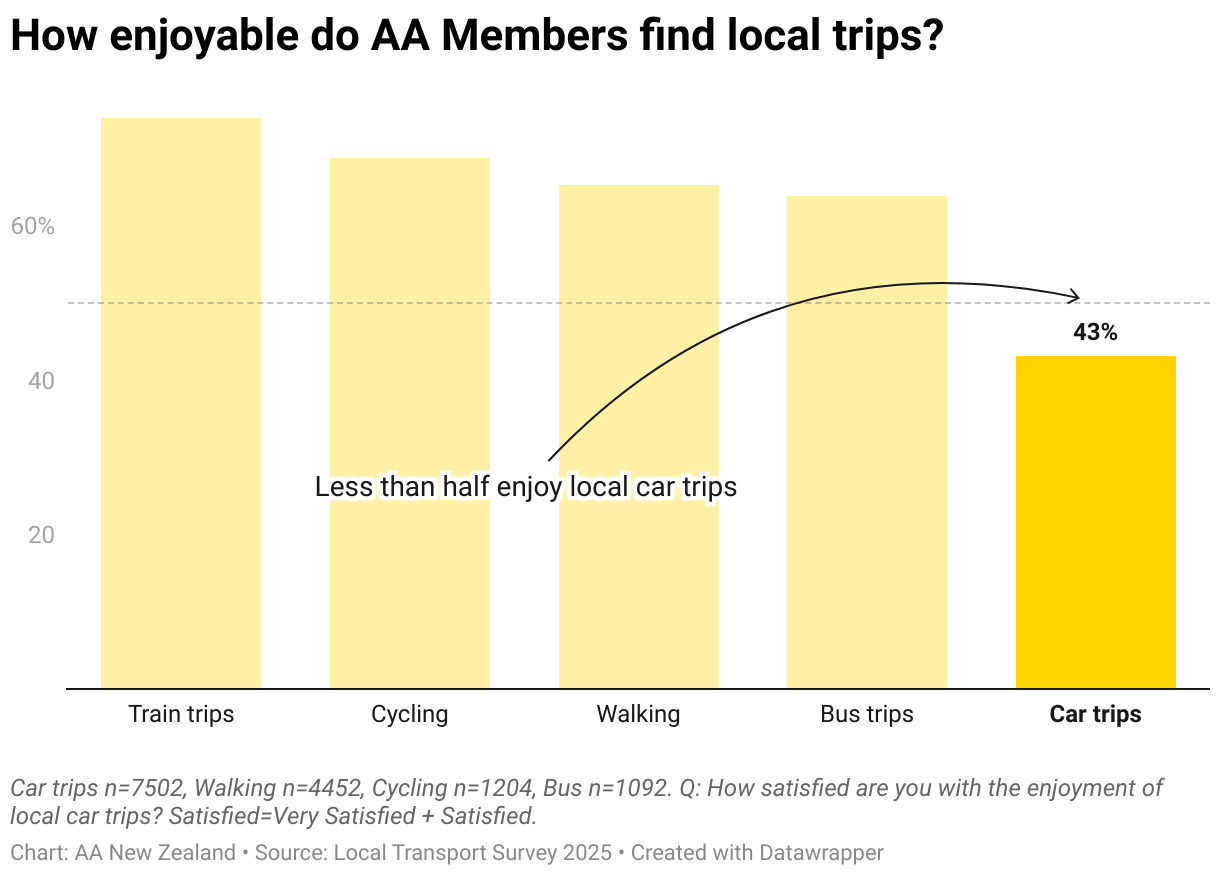
- We found car trips were rated as the least enjoyable, with only 4 out 10 (43%) of Members being satisfied with them.
- In contrast, more than half of Members enjoyed sustainable modes.
- Over three-quarters (76%) of train users enjoyed their trips. This was followed by cycling (69%), walking (65%), and bus trips (64%).
How has AA Members' local transport use changed in the past year?
Sustainable transport use is increasing
Many AA Members are using sustainable transport options more often, with cycling, public transport, and walking all showing notable increases over the past year.
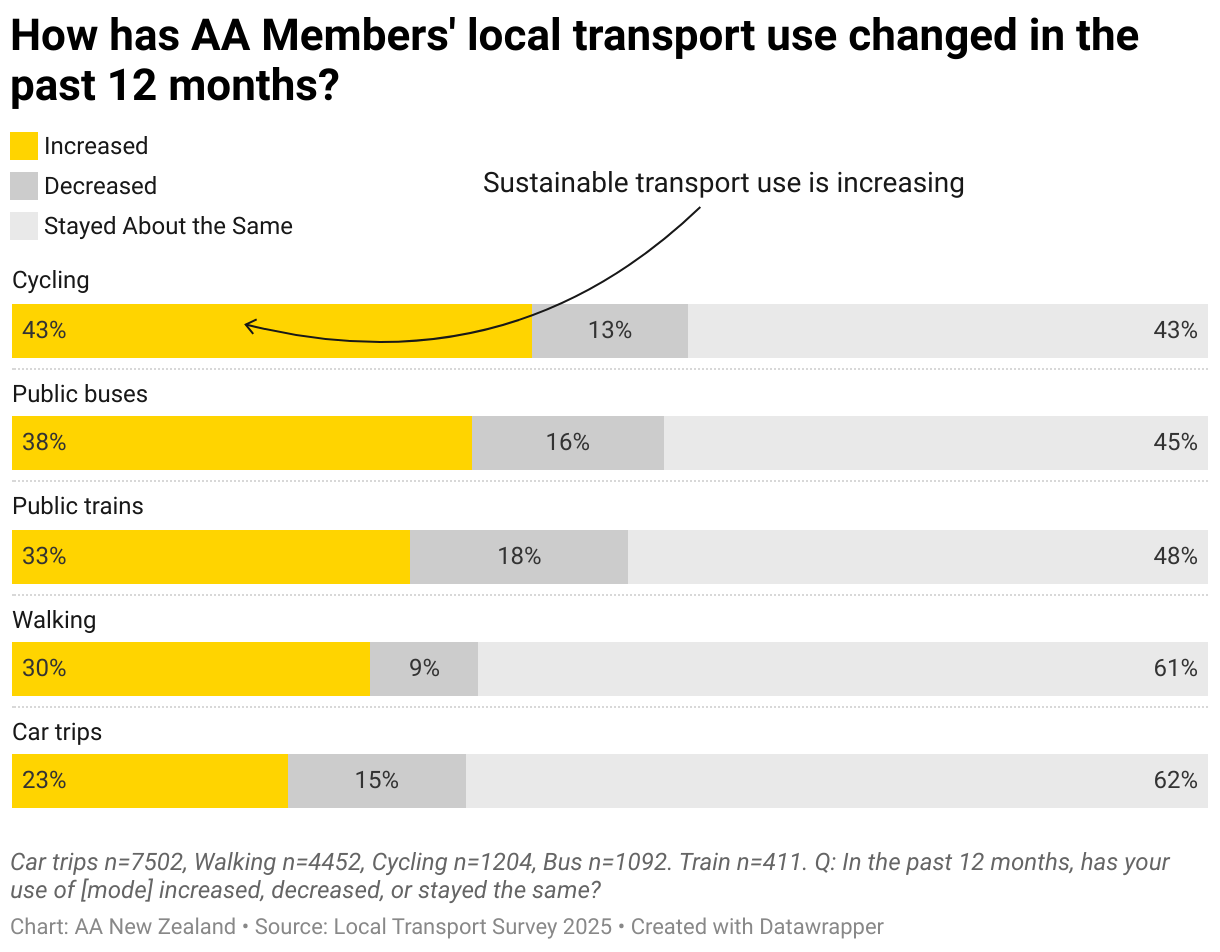
- Nearly half of Members (45%) who cycle are cyling more, while about 1 in 8 (13%) are cycling less.
- Public train use has increased for a third of train users (33%), with 2 out of 10 (18%) reporting a decrease.
- Public bus use is up for 4 out of 10 bus users (38%), and down for about 1 in 6 (16%).
- Walking has increased for 1 in 3 pedestrians (30%), and down for 1 out of 10 (9%).
- Car trips are the most stable, with 6 out of 10 Members (62%) saying their use stayed the same. About 1 in 4 (24%) are driving more, and about 1 in 7 (15%) are driving less.
Logistical reasons drive why AA Members increase their car use
About 1 in 4 AA Members (23%) increased their travel by car in the past 12 months. This was mostly for logistical reasons such as needing to reach multiple destinations (33%), travelling more frequenty (30%), change in personal circumstances (24%), and convenience (24%).
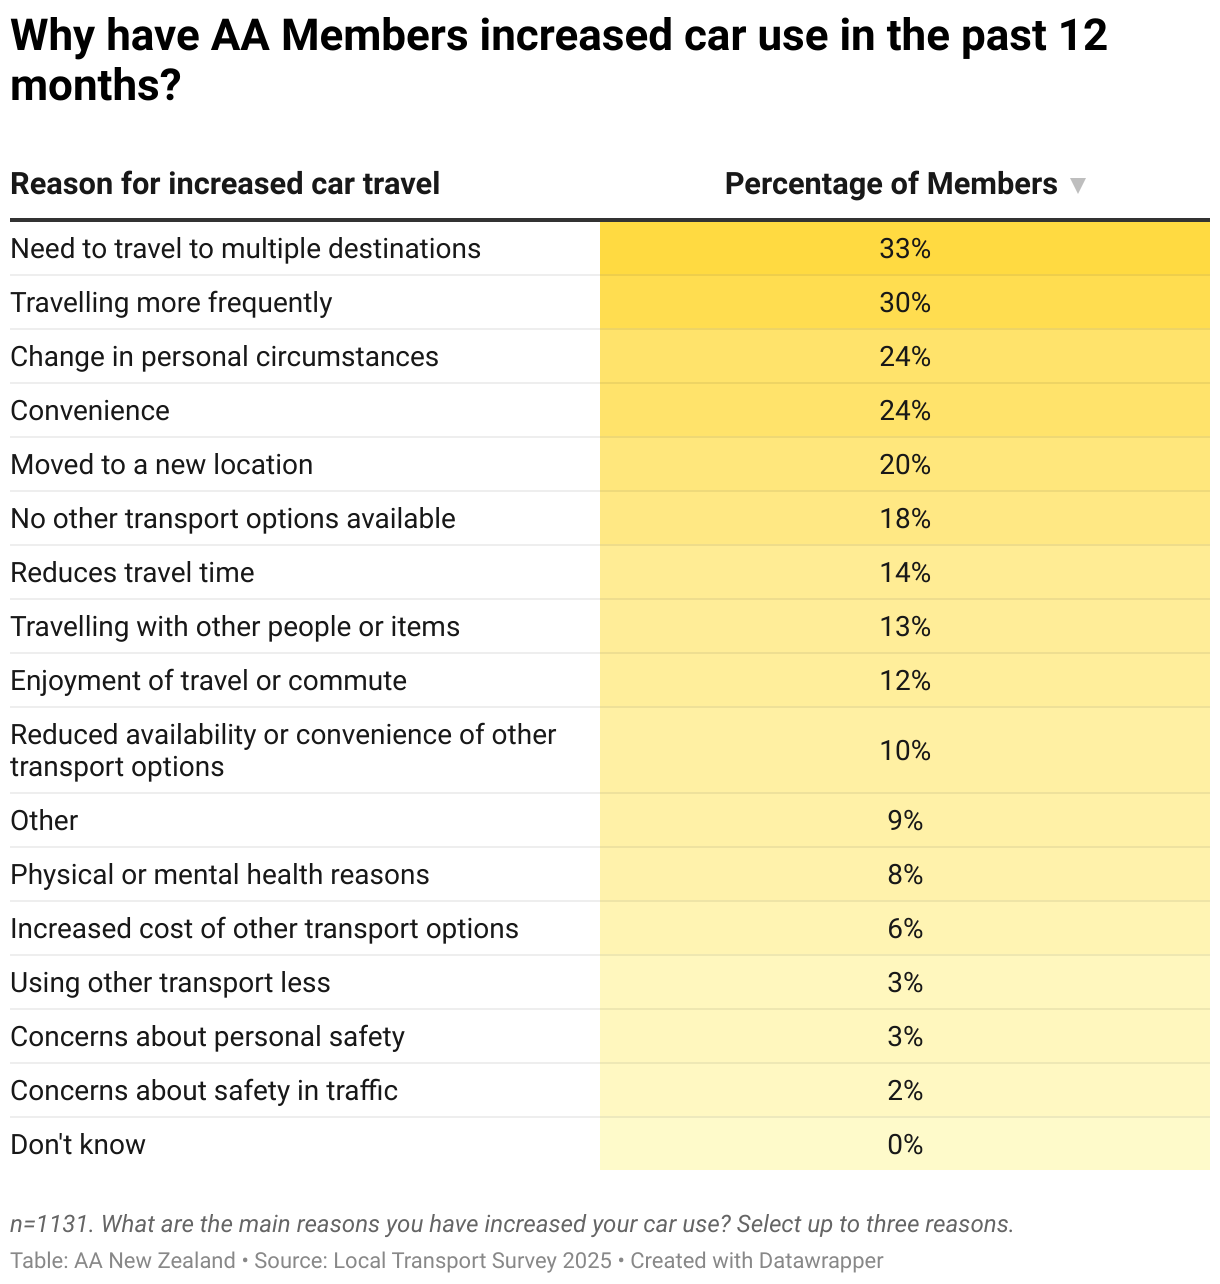
- Needing to travel to multiple destinations is the main reason Members increased their car use - about 1 in 3 nationally (33%). This was highest in the Bay of Plenty and Southland, where 2 out of 5 Members cited needing to reach multiple destinations as their reason for increased car use (41% and 38% respectively).
- 4 out of 10 Members in Nelson (39%), and a third of Southland Members (30%) increased car use due to convenience.
- 1 out of 3 Northland Members (31%) are driving more due to a lack of alternative options. This was followed by 1 in 4 in Otago (28%), and South Canterbury (26%).
Travelling less and car costs are key reasons for decreased car use
15% of AA Members made less car trips in the past 12 months. Travelling less, costs, and switching to other modes are key reasons for less car travel.
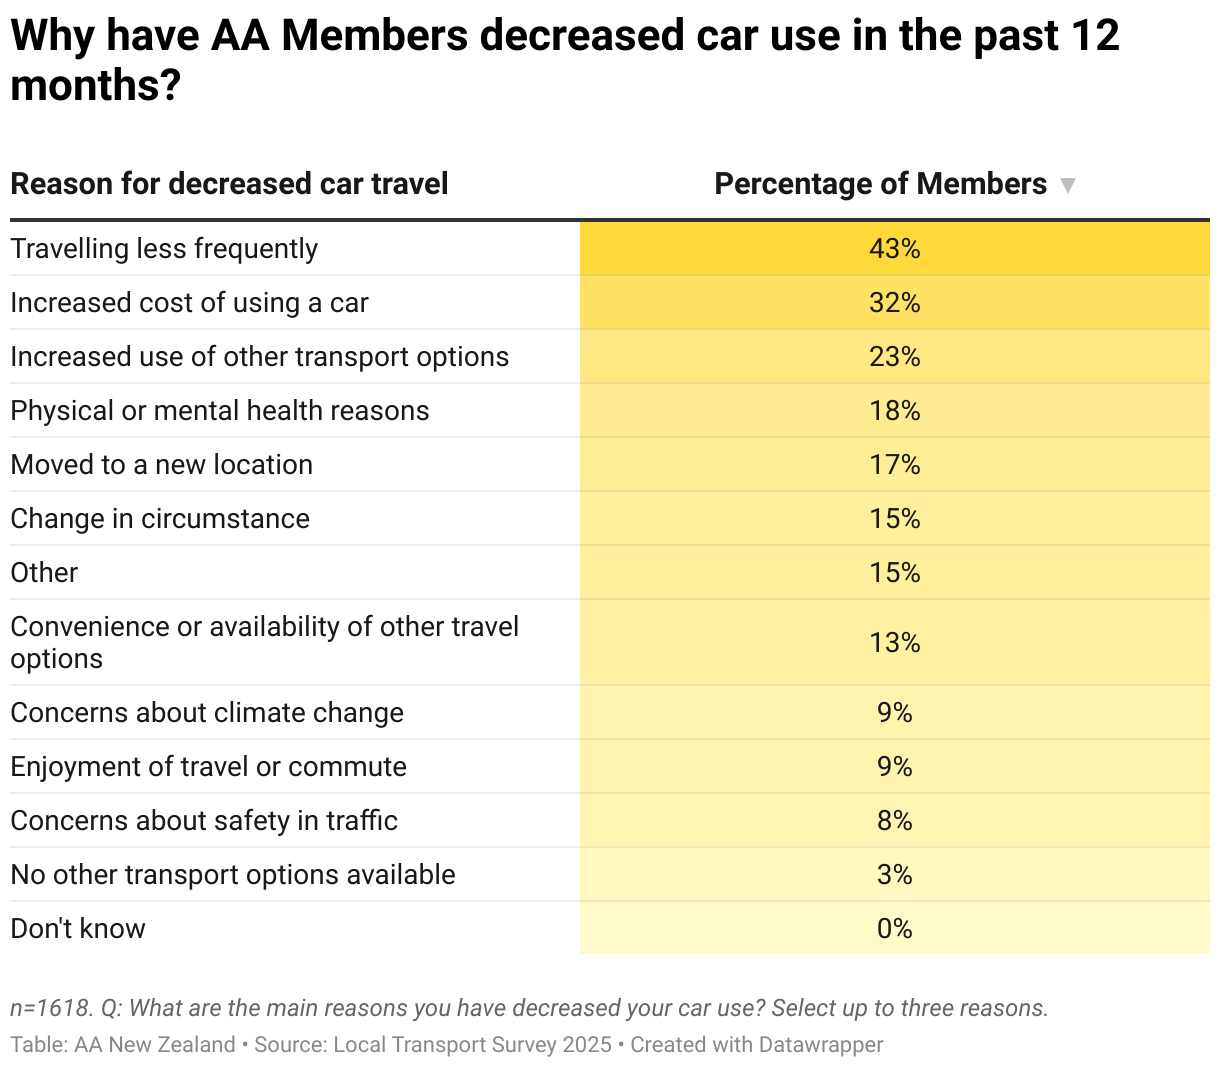
- Travelling less frequently is the top reason Members decreased car use, with 4 out of 10 Members citing this (43%). This was especially the case in South Canterbury, with 8 out of 10 (78%) travelling less frequently.
- Cost is a major factor for nearly half of Members in the Wairarapa (49%) and North Otago (45%).
- Switching to other transport is common in Wellington (43%) and Nelson (32%).
How satisfied are AA Members with car trips?
AA Members are the least satisfied with car trips
Nearly all AA Members had driven in their local district in the past 4 weeks (97%). 6 out of 10 (60%) had taken at least one trip as a passenger. Nearly half were disappointed with most aspects of car travel.
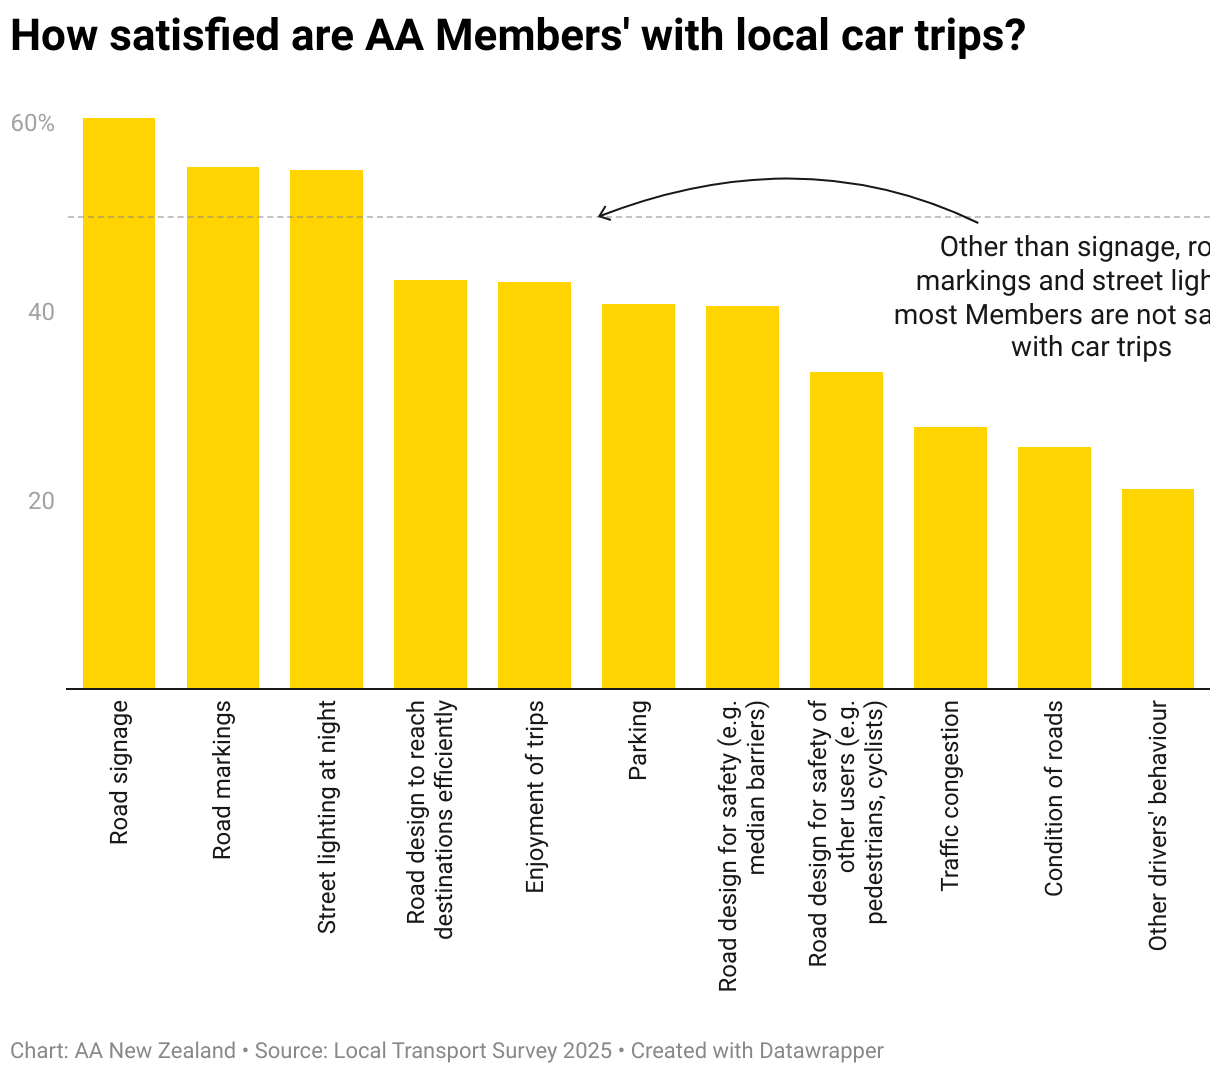
- Only 1 in 4 Members (26%) are satisfied with the condition of local roads, such as potholes. Road condition is one of the most widespread concerns, with 54% expressing frustration. This trend is especially pronounced in regions like Northland (76% dissatisfied), Taranaki (69%), and the Wairarapa (67%). This was often due to potholes, uneven surfaces, and perceived neglect of maintenance.
- Other drivers’ behaviour also drew consistent criticism, with only 1 in 5 Members (21%) being satisfied, and over half (51%) of Members dissatisfied. Whanganui leads this concern with 57% dissatisfaction, followed closely by South Canterbury (55%) and Auckland (54%). Members frequently cited aggressive driving, poor rule-following, and lack of courtesy as key issues.
- When it comes to road design for safe car trips, 2 out of 5 Members (41%) are satisfied, and 30% of Members are dissatisfied. Dissatisfaction is notably high in the Wairarapa (48%) and Northland (38%).
- Road design for safety of other users, such as pedestrians and cyclists, also receives mixed reviews. Nationally, 34% were satisfied, but dissatisfaction sits at 37%, with particularly high concern in Northland (47%), Wellington (39%), and Nelson (43%). This suggests that inclusive design is still falling short in many areas.
- Finally, parking shows a split picture. While 41% of Members are satisfied nationally, 35% are dissatisfied, especially in Auckland (43%) and Wellington (45%), where availability and cost are likely contributing factors.
Poor road condition is an issue across the country
Nationally, only 1 in 4 AA Members (26%) are satisfied with the condition of local roads. In contrast, over half (54%) of Members are dissatisfied with road condition, making it one of the most negatively rated aspects of driving.

- Dissatisfaction with road conditions is most pronounced in Northland, where more than three-quarters of Members express concern (76%). The more rural areas of the Wairarapa (67%), South Canterbury (64%), and North Otago (62%) also show very high levels of dissatisfaction, reflecting widespread frustration with potholes, surface quality, and maintenance.
- In contrast, fewer than half of Members in Otago (42%), Auckland (45%), and Wellington (44%) report dissatisfaction, though satisfaction remains modest.
- Regions like Nelson (48%) and Marlborough (50%) sit close to the national average for dissatisfaction, suggesting mixed experiences.
“Roads are in a very bad state, very bumpy and full of potholes. This makes travelling very unpleasant for my disabled partner and her elderly parents.” -AA Member, Nelson
“Make the roads safe, don't just throw loose gravel on the top and call it fixed. Windshields are replaced far too frequently here up in the North.” -AA Member Northland
"Despite regular roadworks the state of roads, both state highways and local roads, are appalling. The quality of materials available for contractors to use has reduced, and this has an obvious knock on effect with the amount of repairs needed on recent 'fixes'." -AA Member, South Canterbury
Nearly half of Members are dissatisfied with traffic congestion
Only 1 in 3 ( 28%) of AA Members are satisfied with traffic congestion; nearly half (46%) of Members are dissatisfied.
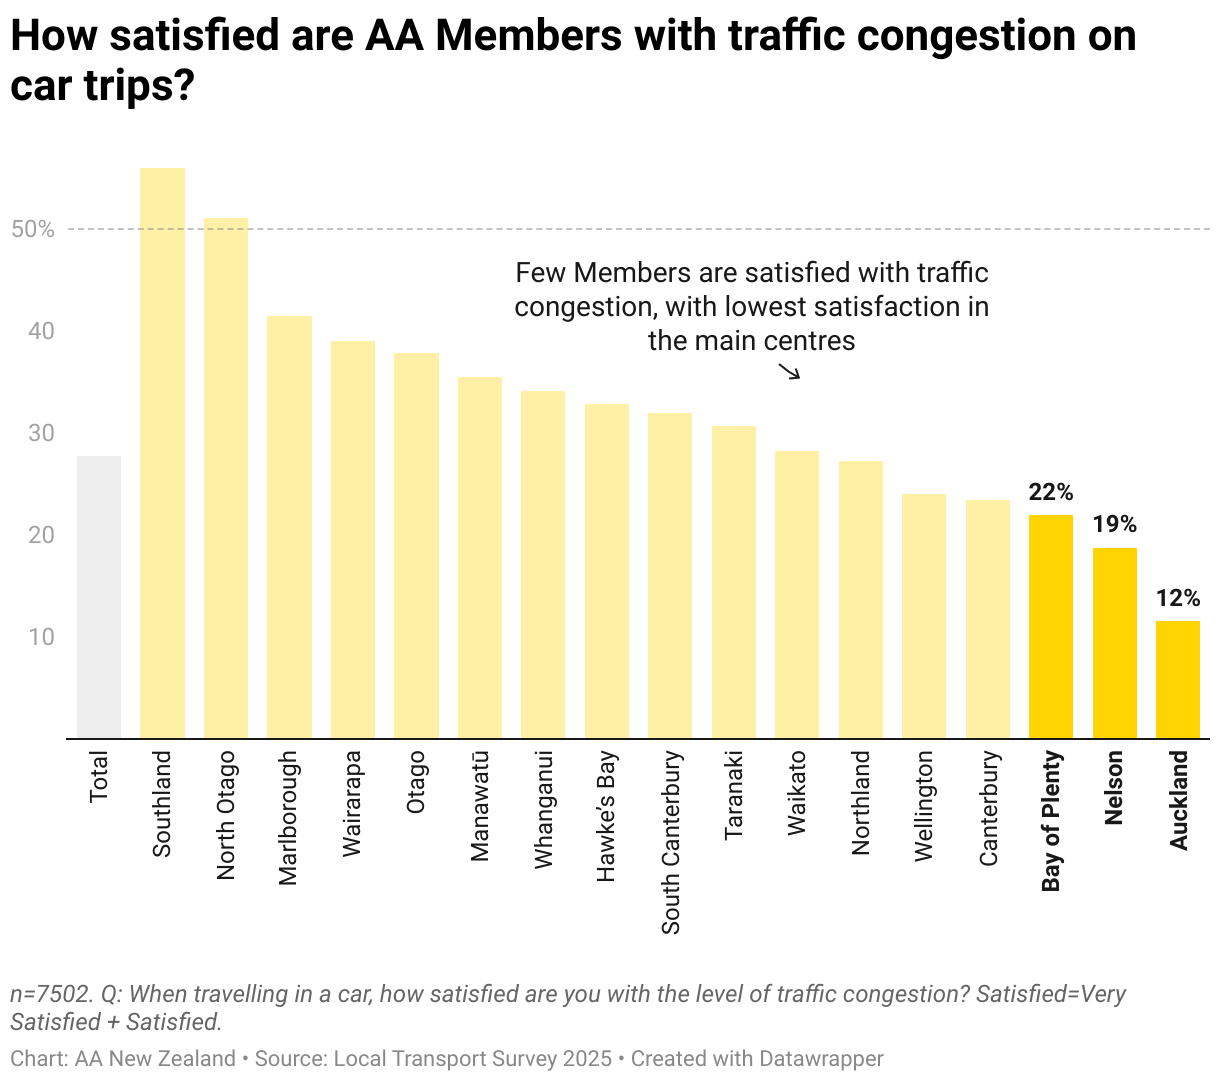
- Dissatisfaction is highest in Auckland, where 7 out of 10 (70%) of Members are unhappy with congestion, and only 12% are satisfied. Nelson (62%), Bay of Plenty (56%), and Canterbury (50%) also show elevated concern.
- In contrast, Southland (56%) and North Otago (51%) report the highest satisfaction, with relatively low dissatisfaction.
"My commute to Albany takes 1.5 hours. There is no way to get through Albany at busy times without spending an hour on Albany hill.” -AA Member, Auckland
“Why work on all roads into a major city at the same time? It’s completely bonkers. Constant delays and frustrated drivers create dangerous conditions.” -AA Member, Canterbury
A third of Members are dissatisfied with car parking
Satisfaction with parking is mixed. Nationally, 4 out of 10 (41%) AA Members are satisfied, but 35% are dissatisfied, with the rest neutral.
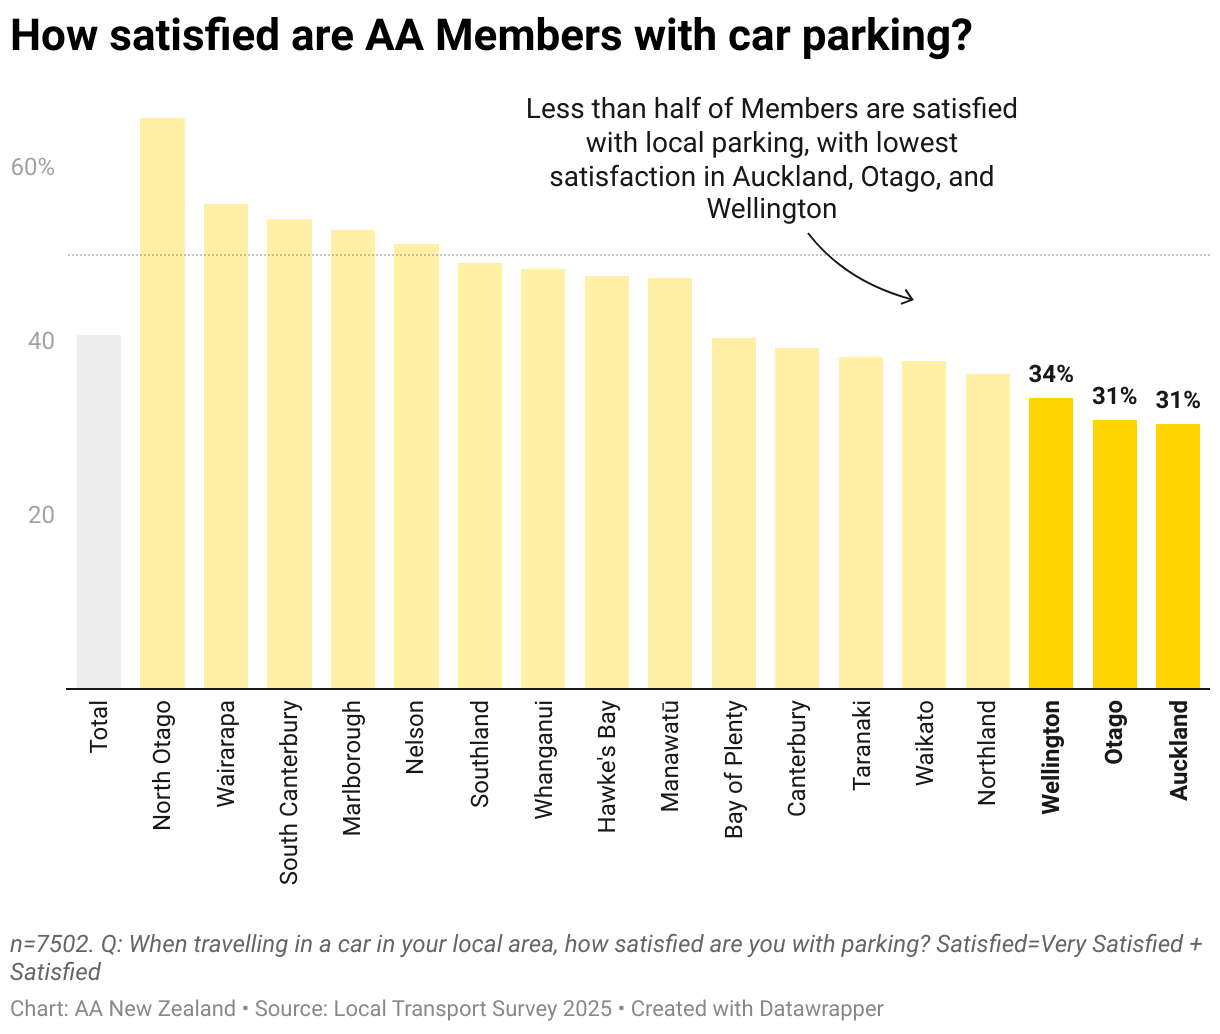
- Dissatisfaction is highest in main centres; Otago (50%), Wellington (45%), and Auckland (43%). This suggests pressure on space or poor layout in these areas.
- Satisfaction is highest in North Otago (66%), the Wairarapa (56%) and South Canterbury (54%). These areas are more rural and therefore may have more parking available.
“I take my spending money to malls or outer suburbs where parking is free. Town is too hard.” -AA Member, Wellington
"Intensified housing is causing major disruption to traffic flow on suburban streets that are now permanently blocked by parked vehicles on both sides of the road. Inadequate parking on properties results in parking on roadside disrupting the flow of traffic by narrowing the road to one vehicle width." - AA Member, Auckland
"I don't mind creating more cycle lanes but taking away parking spaces and not replacing them somehow in a utilised public area is counter productive. There are not nearly enough cyclists to justify the means." -AA Member, Waikato
How satisfied are AA Members with local walking trips?
AA Members are mostly satisfied with walking, but driver behaviour and accessibility are issues
6 out of 10 (60%) of AA Members had taken at least one trip walking on local footpaths or public tracks in the past 4 weeks . Together with being a car passenger, this was the second-highest used travel mode.
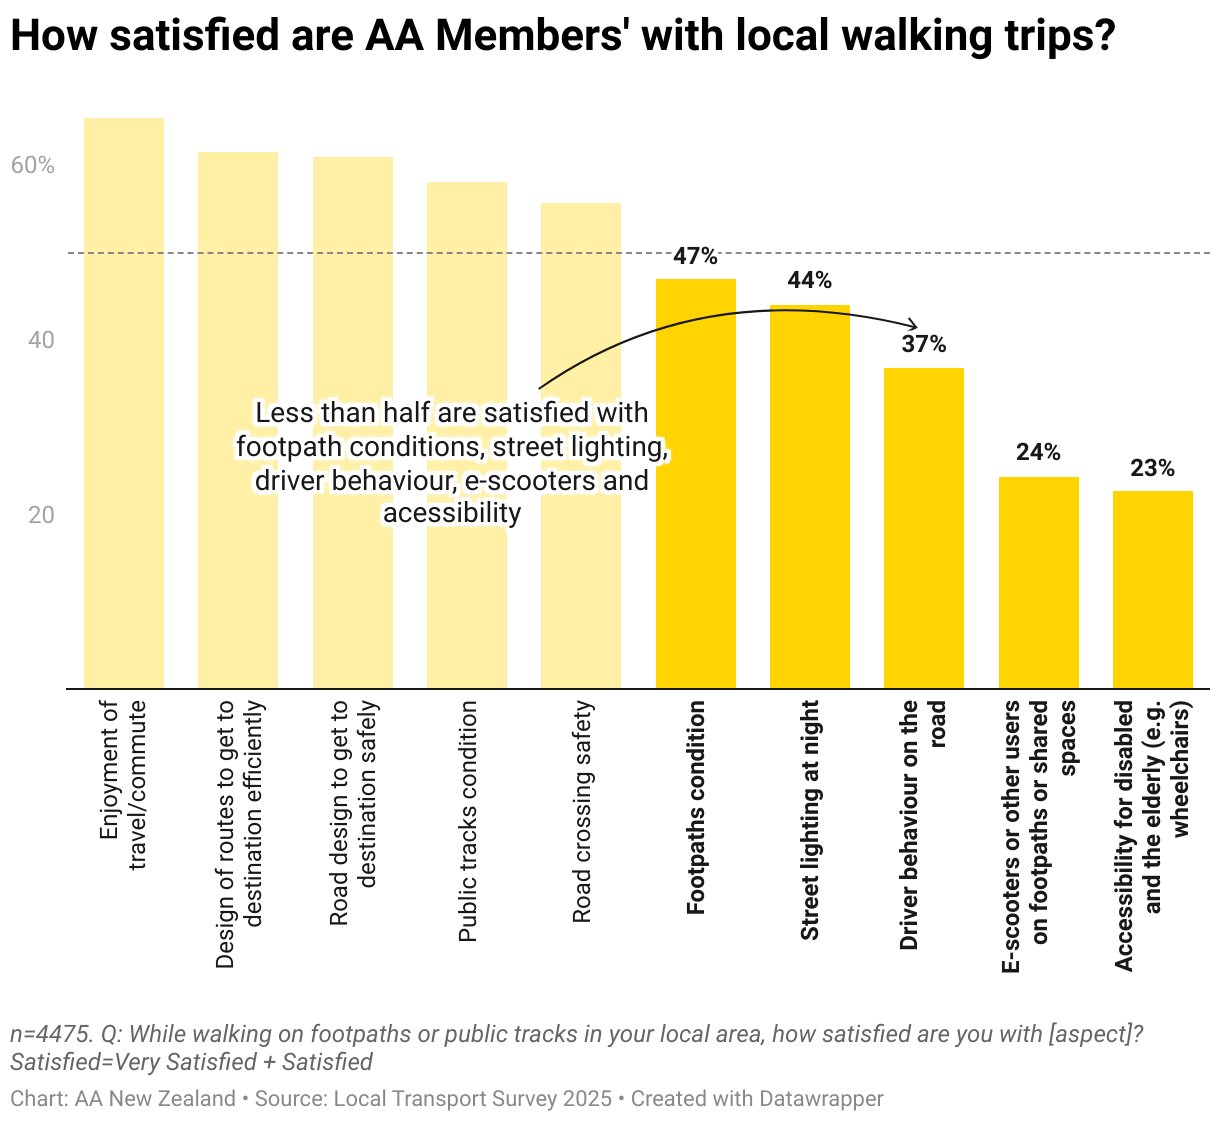
- 6 out of 10 (61%) of Members are satisfied with how well walking routes are designed to reach destinations efficiently. Satisfaction is highest in South Canterbury (71%), Whanganui (70%), and Hawke's Bay (69%).
- Enjoyment of walking locally is relatively high nationally, with 7 out of 10 being satisfied or very satisfied (65%). Top scores were in Marlborough (73%), North Otago (73%), and Nelson (70%).
- 6 out of 10 (60%) Members are satisfied with how well roads are designed for pedestrian safety. The highest satisfaction is in Hawke's Bay (69%), Otago (66%), and Marlborough (67%). Dissatisfaction is higher in Northland (21%) and North Otago (21%), suggesting regional safety concerns.
- Only 1 out of 4 Members (24%) are satisfied with shared space safety, while 40% are dissatisfied. Dissatisfaction is highest in Auckland (51%), Nelson (46%), and Wellington (45%).
“The limited street lighting is a danger. There is plenty of room on the road for cyclists and scooters so the enforcement of NOT riding on footpaths is needed, especially as the population is quite elderly.” -AA Member, Bay of Plenty
“I do a lot of walking around Kapiti—up to 10k a day—and the state of pavements and vehicles parking on them can make walking difficult or unpleasant. The pavements are very difficult in places for wheelchairs and mobility scooters.” -AA Member, Wellington
1 in 3 AA Members are dissatisfied with footpath accessibility
Only 1 out of 4 (23%) of AA Members reported being satisfied, and 27% were neutral. Nearly a third of Members (29%) are dissatisfied with accessibility for elderly or disabled on local walkways. A further 22% said they didn’t know or felt it didn't apply to them.
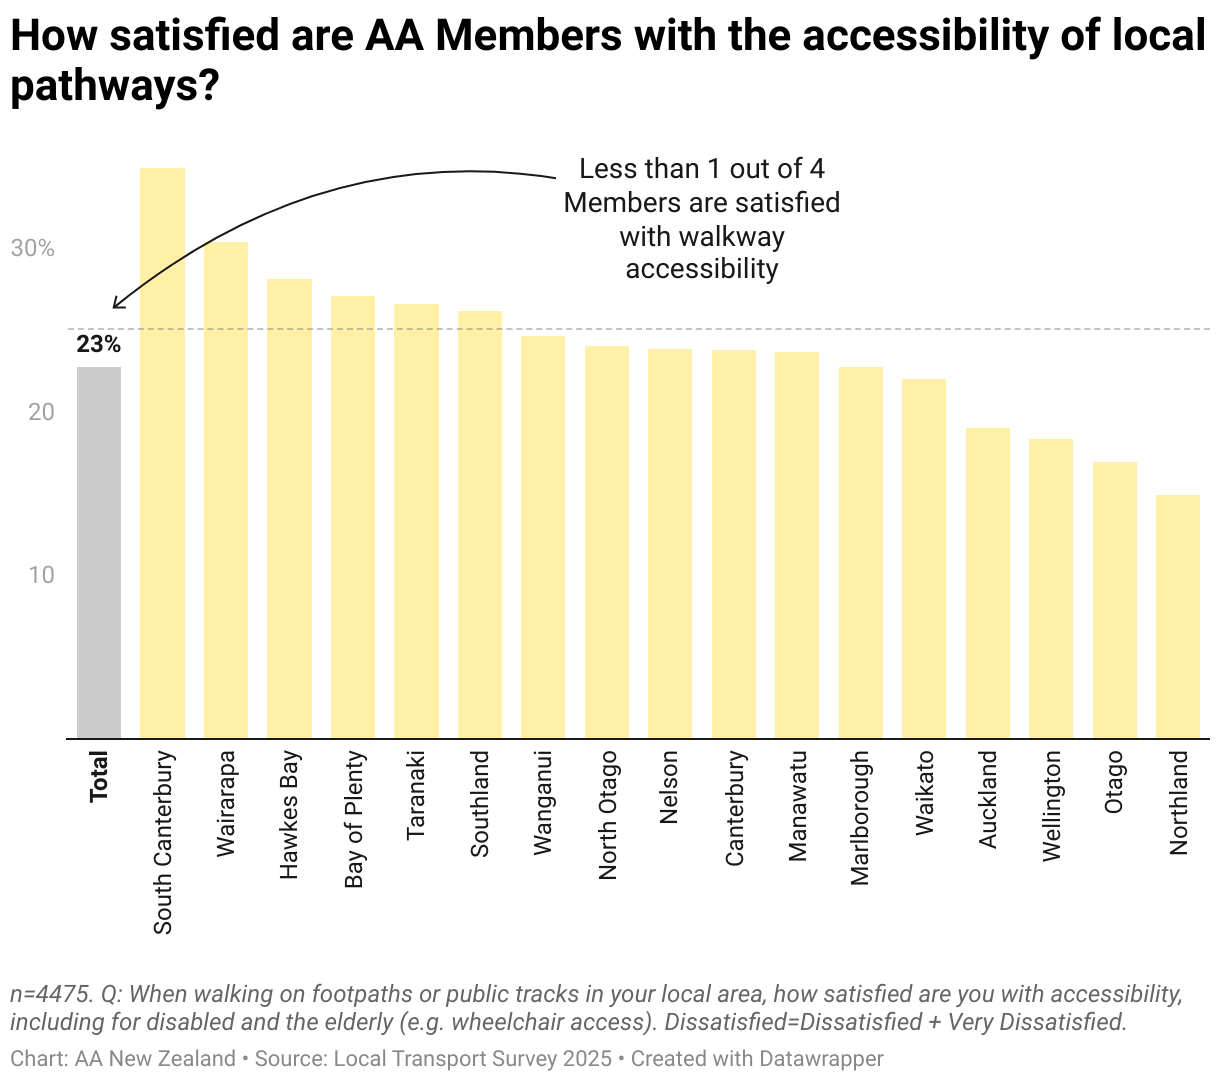
- While low, the highest satisfaction for pathway accessibility was in South Canterbury (35%), followed by the Wairarapa (30%), Hawke's Bay (28%), Bay of Plenty (27%), and Southland (26%).
- In contrast, Northland had the lowest satisfaction at 15%, as well as the highest dissatisfaction at 42%. Auckland (19%), North Otago (24%), and Wellington (18%) also showed below-average satisfaction and above-average dissatisfaction, suggesting accessibility challenges in these areas.
"Maintenance of roads and footpaths should be a priority Roads slumping and potholes Footpaths tree roots and lifting paths are so dangerous for the elderly and disabled." -AA Member, Taranaki
"I believe that the ramps from road to footpaths need to be smoother for mobility scooters. Many are just too steep or the step up too high." - AA Member, Whanganui
"Living in town there are a lot of areas that still lack footpaths altogether, which is quite worrying - particularly with one road which goes past the kura but still has no footpath.” -AA Member, Northland
How satisfied are AA Members with local bike trips?
Cycling is enjoyable, but safety is a concern
1 in 7 (15%) of AA Members biked locally in the past 4 weeks. Members are generally positive about cycling, especially where infrastructure is well-designed.
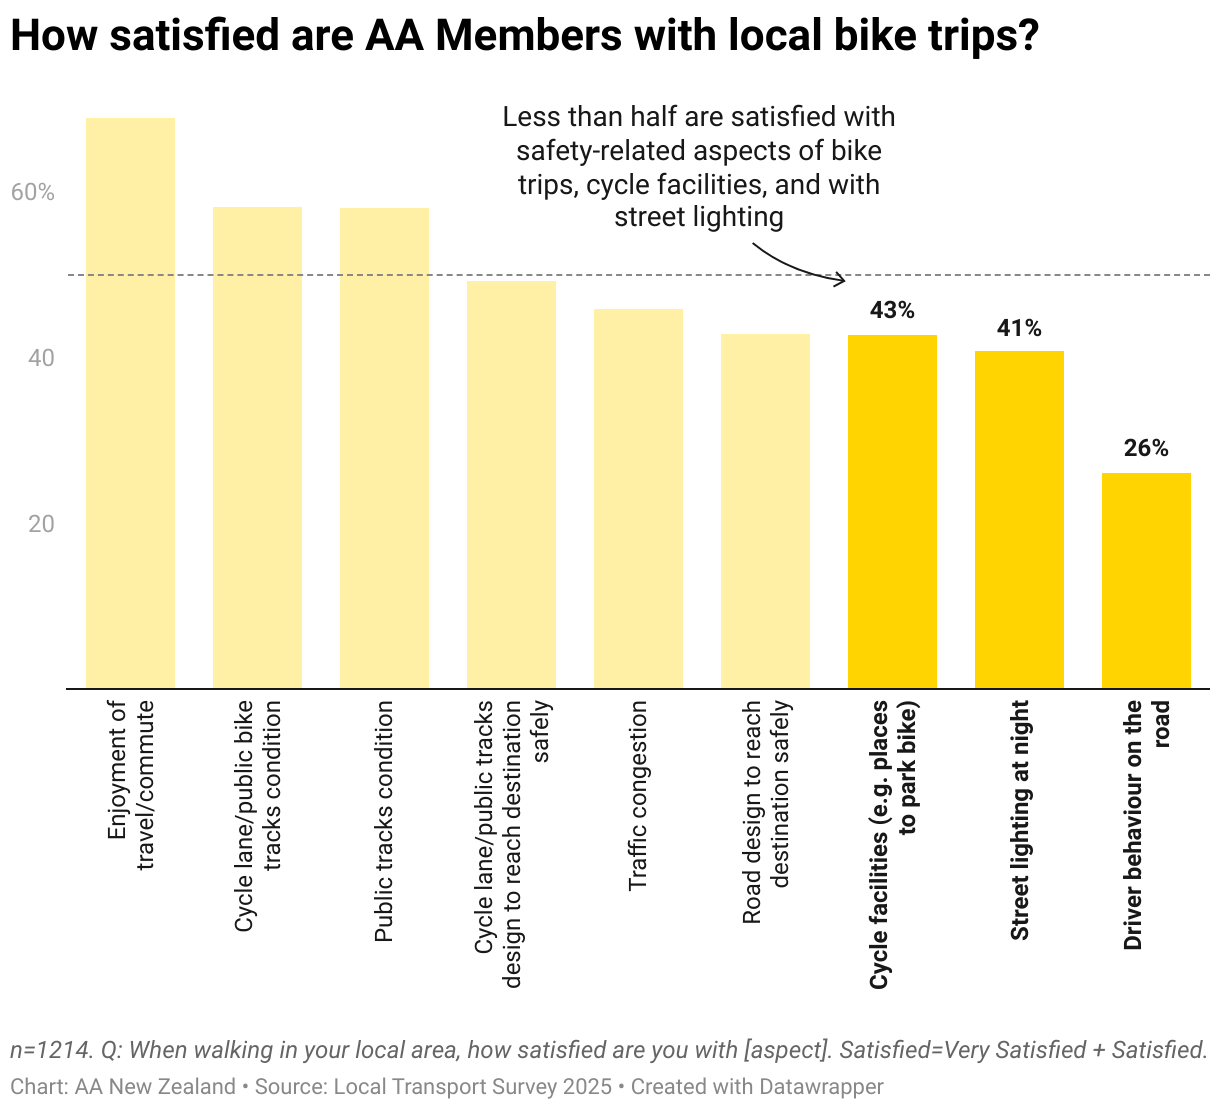
- Enjoyment of travel is high among cyclists, with 69% satisfied nationally, and even higher in regions with better infrastructure like Marlborough, Otago, and South Canterbury.
- Satisfaction with cycle lane condition is relatively high, with 6 out of 10 (58%) enjoying their cycling trips. Top scores were in Otago, Bay of Plenty, and Canterbury.
- However, satisfaction drops to 49% when asked about cycle lane design to reach destinations safely, suggesting that layout and connectivity matter as much as surface quality.
- Satisfaction with safe road design for cycling is lower still at 43%, with high dissatisfaction in Northland (55%) and Auckland (44%), where cyclists may feel less protected.
- Cycle facilities like bike parking are rated positively by 43%, but again vary widely by region.
“As a cyclist I feel more cycle lanes would encourage people to use their bikes instead of the car, I hear too often 'I am so scared of cars.' One needs to be very brave in NZ to cycle!” -AA Member, Auckland
“Many cycle lanes just end for no reason at all, others are so complicated with different paint, bollards, barriers, business signboards, trees and business driveways.” -AA Member, Bay of Plenty
What transport improvements do AA Members want?
Roading infrastructure improved AA Members' quality of life
New and improved roads, bridges or tunnels made the most positive difference to AA Members' quality of life. However, most Members (61%) reported no improvements that had increased their quality of life in the past year.
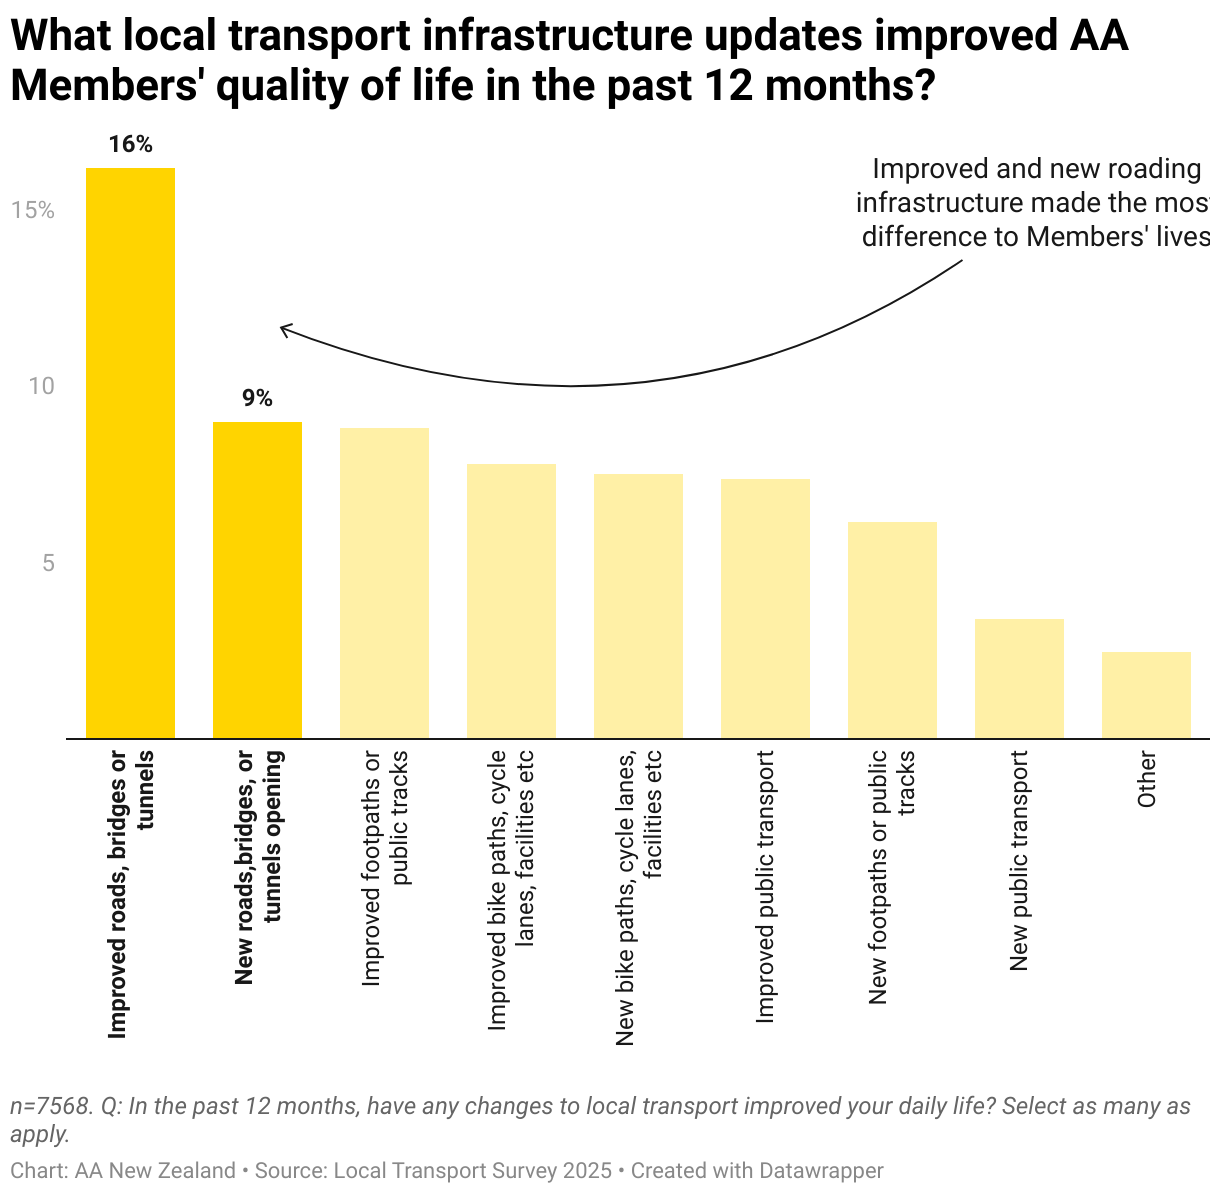
- 6 out of 10 (61%) Members say they don’t feel any recent local infrastructure changes have improved their daily life. North Otago was the most likely to report no improvements (71%), and Marlborough had the highest amount experiencing improvements, at 46% of its Members.
- For the 39% of Members who reported improvements that increased their quality of life, they were most often due to better roads or bridges (16%), with the highest rates in both Hawke's Bay and the Wairarapa (22% each). Nelson Members experienced the least improvements here (9%).
- Improved footpaths or tracks was next at (9%), particularly in Marlborough (12%).
- New and improved cycling infrastructure (both 8%) also received relatively high ratings, with 12% of both Canterbury and Nelson Members reporting improvements in quality of life for both aspects.
AA Members want funding for roading infrastructure and public transport maintained
AA Members want local funding for roading infrastructure to be maintained, likely reflecting high rates of car travel and the importance of reliable infrastructure for all transport modes.
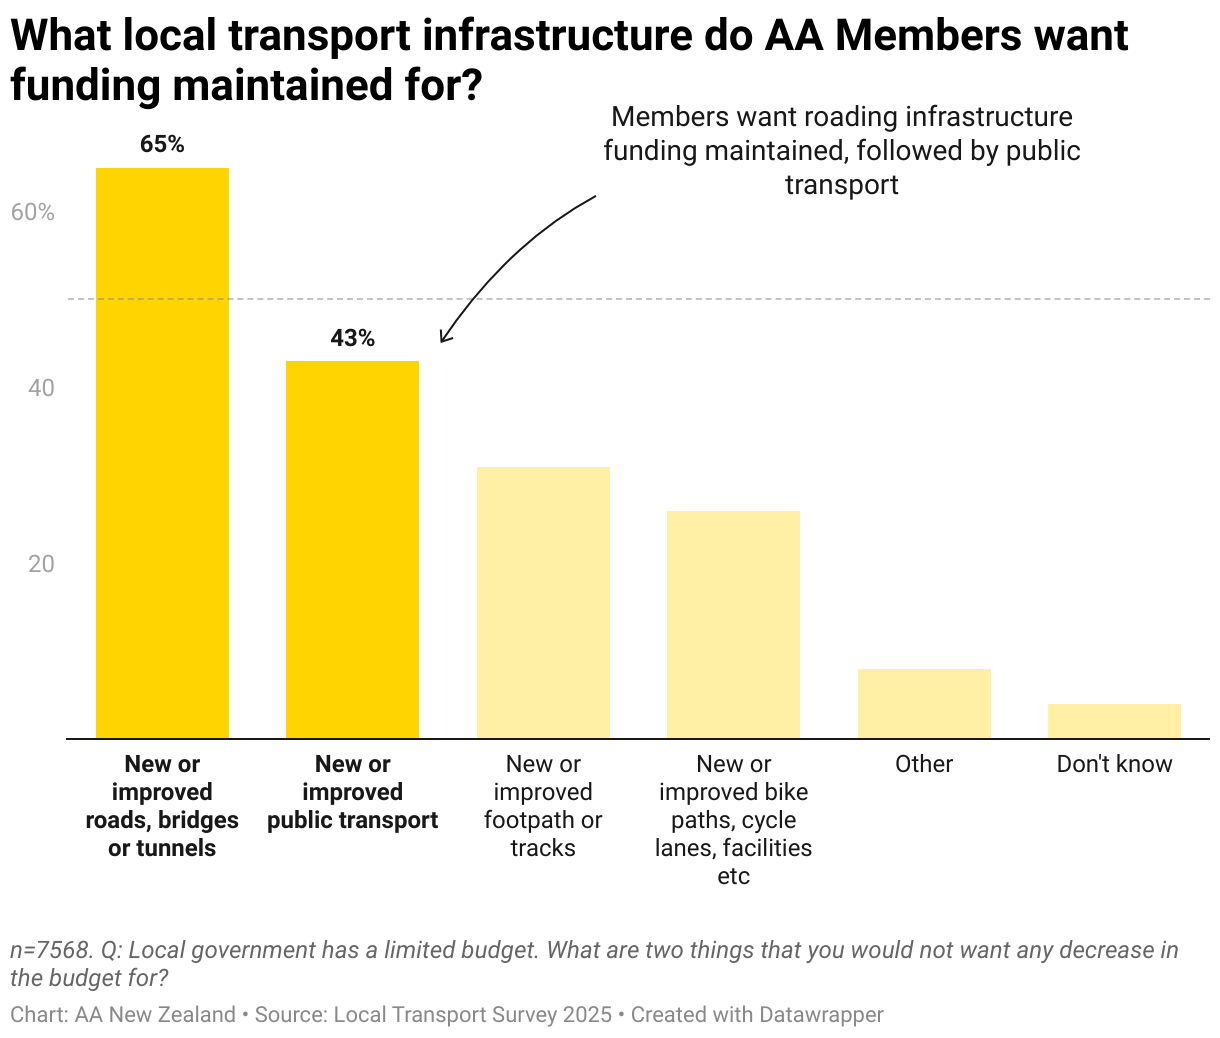
- When asked what funding should be maintained for local transport improvements, Members most often chose new or improved roads (65%). This was highest in Hawke's Bay at 74%, Northland and the Wairarapa (both 73%).
- This was followed by public transport (43%). This was highest in Wellington (65%).
- 1 out of 4 Members wanted funding maintained for cycling infrastructure (26%), which was highest in Nelson at 37%.
- Most Members feel that drivers are currently prioritised for transport improvements (54% nationally), especially in Southland (70%), the Wairarapa (70%), and South Canterbury (69%).
- However, many would like to see a more balanced approach, with increased priority for public transport users (38%), particularly in Wellington (61%), the Wairarapa (53%) and Auckland (52%).
AA Members feel safest when infrastructure is designed to protect all road users
AA Members feel safest when infrastructure is designed specifically for their mode of travel.
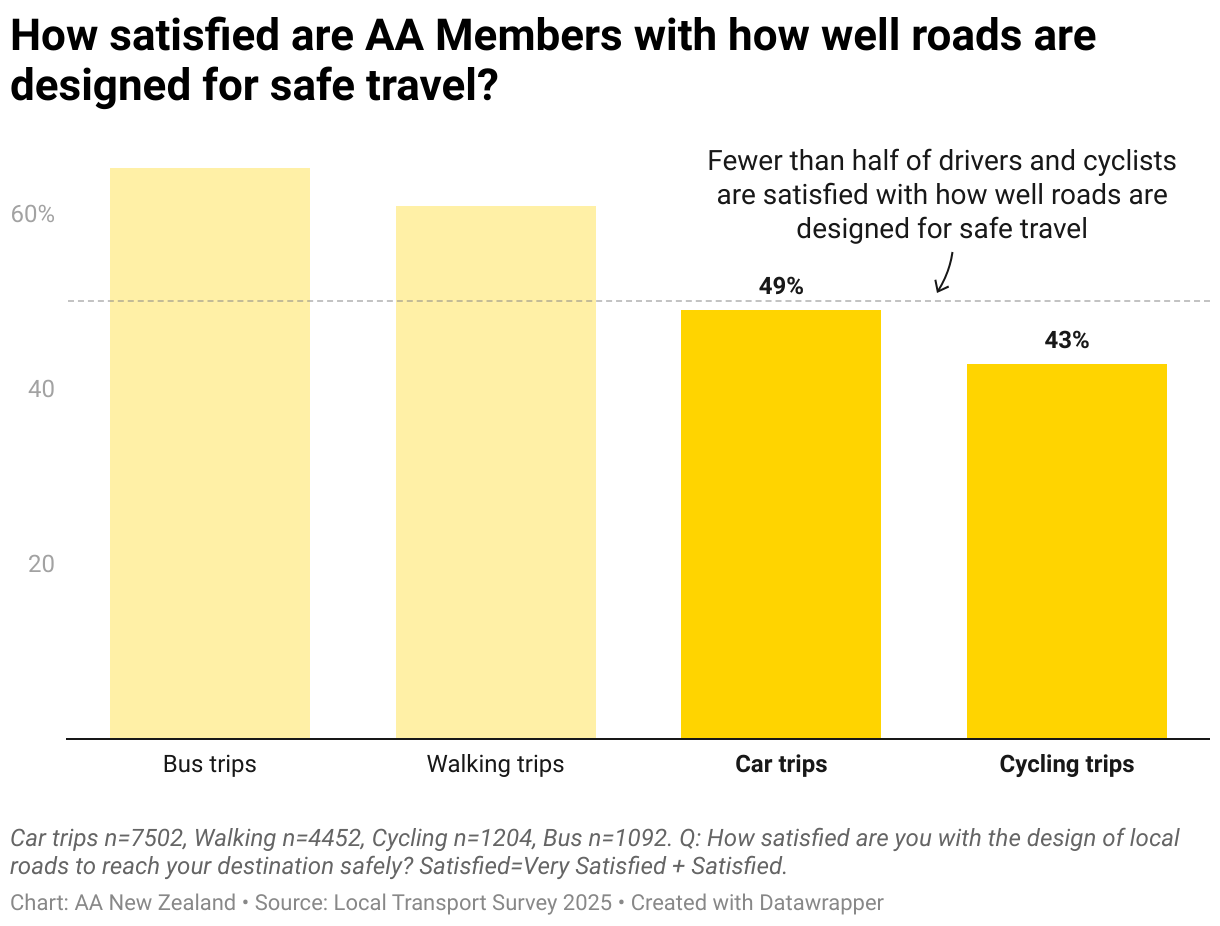
- Members feel safest when infrastructure is designed specifically for their mode of travel. Satisfaction is highest for bus route design (65%) and walking route design (61%), where routes are clearly defined and separated from traffic.
- For cycling, satisfaction with cycle lane design is moderate (49%), but drops for general road design while cycling (43%), suggesting cyclists feel a little safer with dedicated infrastructure.
- Drivers are less satisfied overall, with 49% rating road design for safety positively. However, when asked about road design for the safety of other users, only 34% were satisfied, and 37% were dissatisfied, indicating concern about how well current designs protect pedestrians and cyclists.
- These results highlight the importance of mode-specific design—Members consistently report higher satisfaction when infrastructure is tailored to their travel method.
"Focus on making it safer and easier for children and those with limited mobility to walk, bike, or take public transport. Doing this benefits everyone - including drivers.” -AA Member, Northland
The geography of my local area makes roads narrow and unsafe for pedestrians and cyclists. Better planning could improve this problem.” -AA Member, Nelson
About the AA Local Transport Survey 2025
The Local Transport Survey 2025 is an annual survey of AA Members. The aim is to understand Members' local transport experiences across modes - including car trips, walking, cycling, bus, and train use. The survey also covers Members' preferences for where local transport improvements are focused, and any recent improvements that improved their quality of life.
The survey was conducted in February 2025 using a randomly selected representative sample of Members. A total of 7,568 Members responded to the survey, out of the 135,244 Members who were invited to participate. This gives us a response rate of 5.6%.
The margin of error for the total sample is approximately ±1.1% at a 95% confidence level. This means that if we repeated the survey with a different random sample of invited Members, the results would likely vary by no more than 1.1 percentage points in either direction.
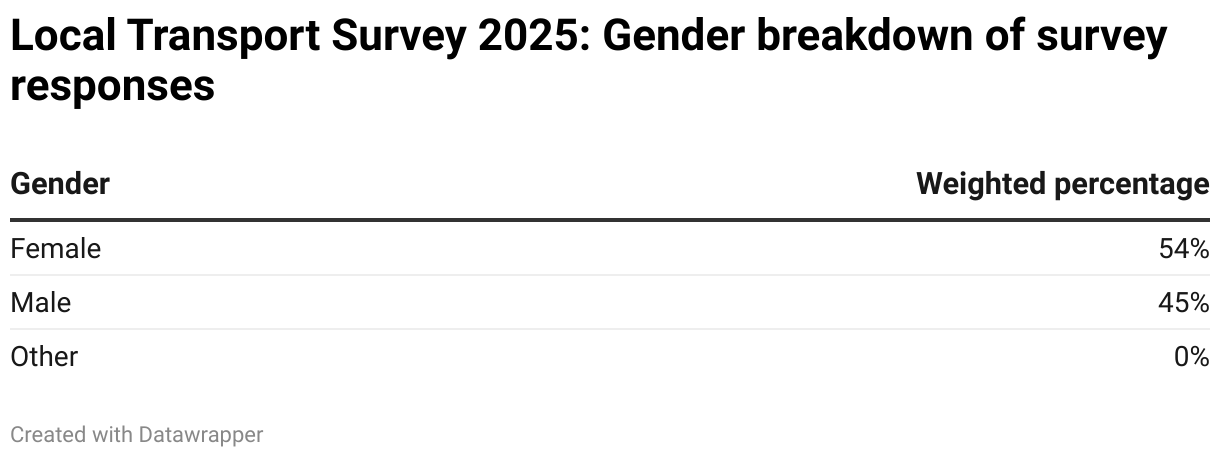
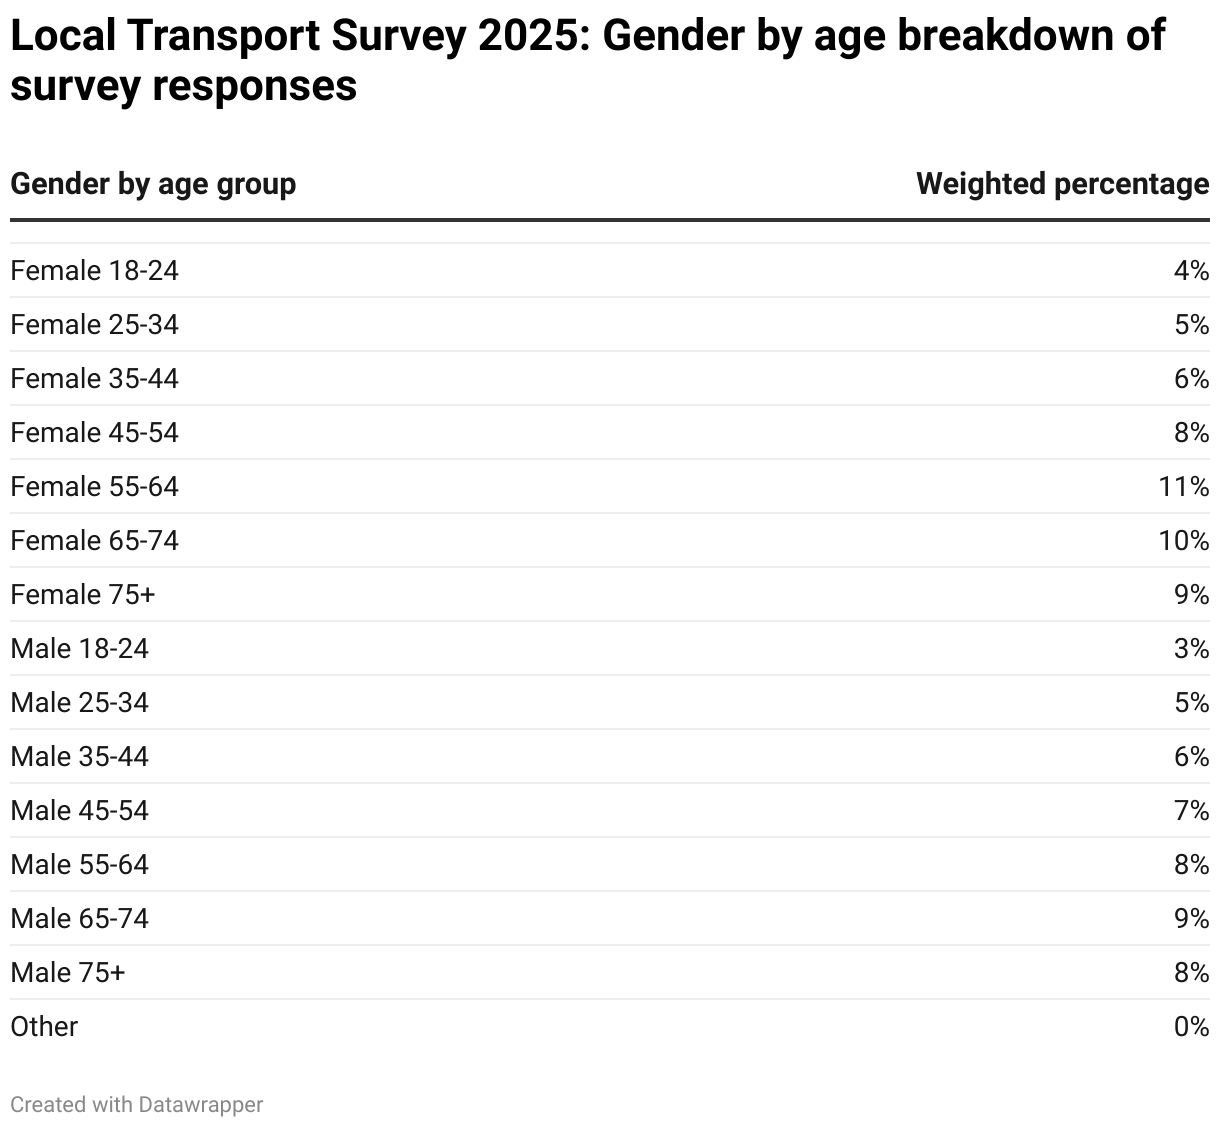
To ensure the results accurately reflect the AA Membership, we applied statistical weighting based on age, gender, and district demographics. For example, if fewer women participated than are represented in the overall AA Membership, their responses were proportionally adjusted to better match the true demographic profile.
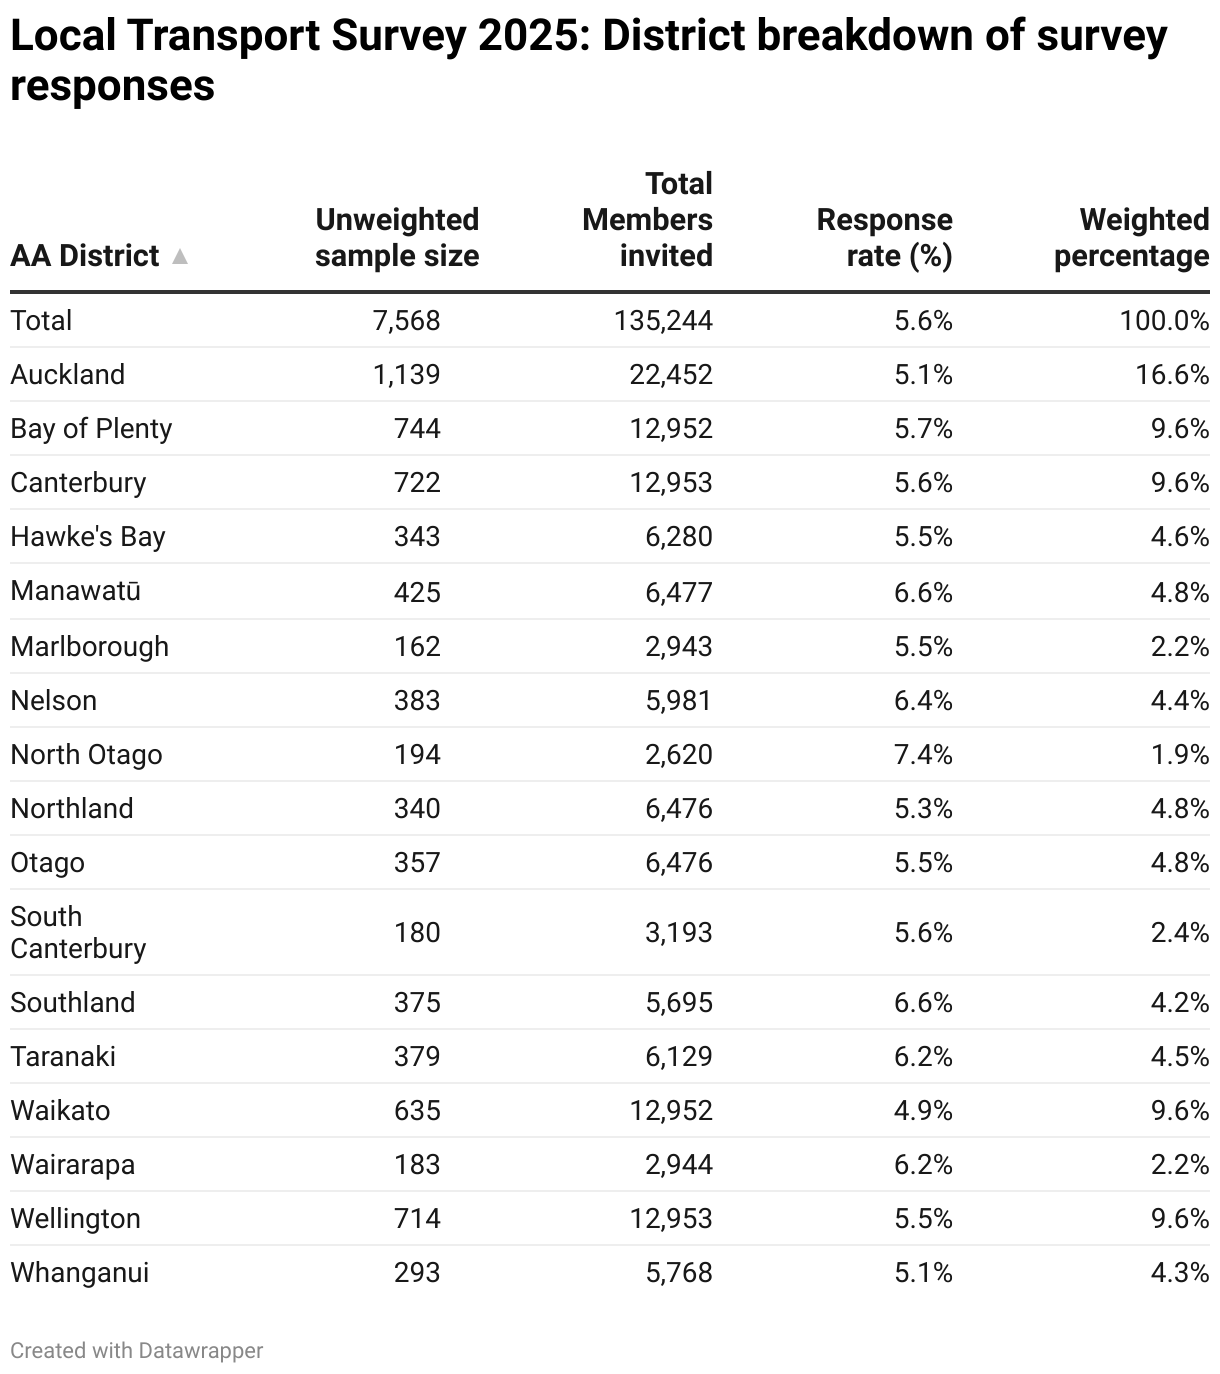
Findings from the Local Transport Survey 2025 are used to understand AA Members' experiences with local transport, and to identify isues that our 18 District Councils around the country can raise with local road controlling authorities.
AA Member survey results help guide the AA's position and advocacy on issues when we are responding to potential changes by authorities, and also to promote our own ideas for improving transport.
The AA's positions are formed considering survey results, evidence from research, our own policy analysis, and the views of AA District Councils from across New Zealand.
Media contact and further information
- For media enquiries, please contact the AA Manager of Research, Safety & Communications Dylan Thomsen, +64 4 931 9991
- For information about the survey or further results, get in touch with our team at membervoices@aa.co.nz.
- Visit the AA Transport Surveys to find out more about the survey programme.