
06 October 2026
What transport improvements matter most for AA Members?
Insights from AA Members on transport infrastructure improvements, from the AA State of Local Transport Survey 2026
Transport infrastructure is something we all rely on every day, whether it's the road we drive on, the footpaths we walk on, cycleways to ride on, or bus lanes for getting where we need to go. It's easy to take for granted until it doesn't work well.
This report looks at the vital transport infrastructure we rely on to get around, for car trips, walking, cycling and public transport. Over 8,000 Members told us whether they had noticed any improvement over the past year to their local infrastructure, what they think most needs fixing, and where they think that work should happen.
The results in this report are based on responses from 8,336 Members randomly invited to participate, including members of the AA Member Voices Panel. A total of 163,748 Members were invited to take part, resulting in a 5.1% response rate. The maximum margin of error at the 95% confidence level is approximately ±1.1%.
The AA State of Local Transport Survey 2026 was conducted between 29 April and 26 May 2026.
Key findings
AA Members’ views on improvements needed in their local transport network
Most AA Members haven't noticed any improvements in local transport infrastructure in the past year
- Two-thirds of Members (66%) say no recent transport infrastructure changes have improved their daily life.
- Where improvements were noticed, they were most often improved roads, bridges or tunnels (13%), followed by improved footpaths or public tracks (8%), improved public transport (7%), improved bike paths or cycle facilities (7%), and new roads, bridges or tunnels opening (7%).
- Whether Members noticed a meaningful improvement depended heavily on how they travelled. Cyclists and public transport users were much more likely to report improvements to the infrastructure they use. For example, 23% of e-bike riders and 19% of bicycle riders noticed cycling improvements that benefited their daily life, compared with 7% of Members overall. Similarly, 19% of bus users and 15% of train users noticed public transport improvements, compared with 7% of Members overall.
- Hawke's Bay Members are the most likely in the country to have noticed at least one improvement (42%), whereas Otago and North Otago were the least likely (both 25%).
- Members living in central city areas are also more likely to report improvements than rural Members (40% compared with 29%).
Road maintenance remains the biggest unmet need
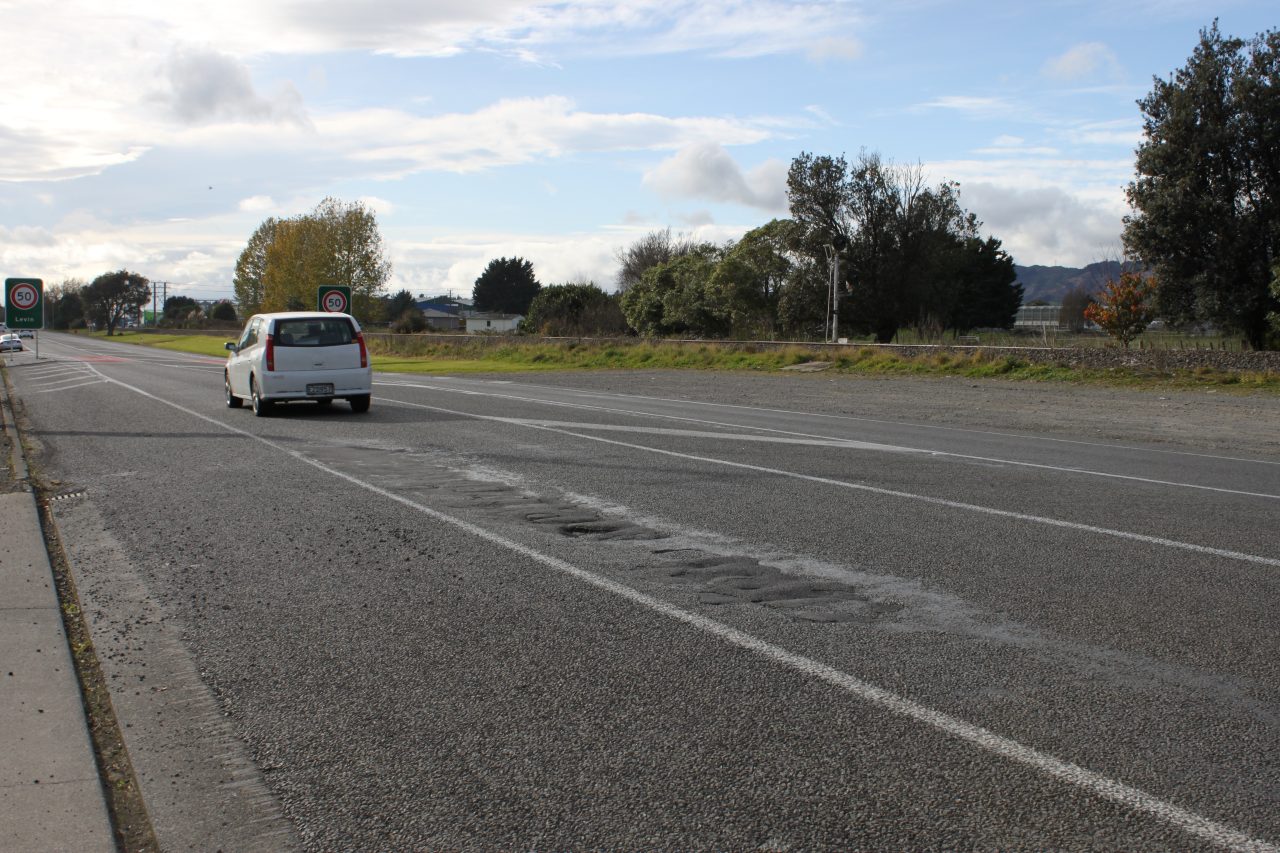
- Nearly half of Members (48%) say smoother roads and fewer potholes should be a priority for improvement - by far the most commonly selected issue.
- Yet only 13% reported noticing improved roads in the past year and just 7% noticed new roads, bridges or tunnels opening.
- The concern appears well founded: more than half of Members (55%) have experienced a road safety issue because of poor road maintenance in the past year, while only a third (34%) are satisfied with road conditions overall.
- Safer roads and driver behaviour is the second-highest priority for Members (43%). Demand is highest in Taranaki and Hawke's Bay (50% each), where dissatisfaction with other drivers' behaviour is also well above average. Concern about road safety appears to be driven more by how Members experience other road users than by infrastructure alone.
What AA Members want fixed depends on where they live and how they travel
- Rural and urban Members often prioritise different parts of the network. Rural Members are twice as likely as central city Members to want state highways prioritised (50% compared with 25%), while city Members are more focused on residential streets and town centres.
- Travel patterns matter just as much. Members who cycle are far more likely to want safer cycling routes prioritised, particularly e-bike riders (52% compared with 19% of all Members). Meanwhile, regular bus and train users are less focused on road condition and more concerned about service frequency and reliability (39% and 46% respectively, compared with 26% overall).
- These priorities generally reflect real-world experience. Only 25% of cyclists are satisfied with the behaviour of other road users, and just 22% feel safe riding on roads without dedicated cycle lanes, rising to 43% where cycle lanes exist.
- Likewise, concerns about walking and cycling are not simply a rural-versus-urban issue. Northland's unusually strong demand for safer walking routes reflects poorer pedestrian safety experiences, while Nelson's higher demand for safer cycling routes largely reflects the fact that more Members cycle there.
What transport improvements have made a difference?
Two-thirds of AA Members haven't noticed any transport improvement in their area in the past year
We asked Members whether any changes to local transport had improved their daily life in the past 12 months. Two-thirds (66%) said no. Improved roads, bridges or tunnels was the most common improvement reported (13%), followed by improved footpaths (8%) and improved cycling infrastructure (7%).
New infrastructure was reported less often than improvements to what already exists across every category.

Whether Members have noticed an improvement depended on where they live:
- Hawke’s Bay Members are the most likely in the country to report meaningful improvements to local transport infrastructure (42%), whereas Otago and North Otago (both 25%) were the least likely to have noticed improvements.
- City Members were consistently more likely to have noticed an improvement than rural Members – 4 in 10 in central city areas (40%) compared with 3 in 10 rural Members (29%).
Whether people reported a noticeable improvement depended on how they got around:
- 23% of e-bike riders and 19% of bicycle riders noticed improved bike paths or cycle lanes, against 7% of all Members, and 20% and 16% respectively noticed new cycling infrastructure (against 6% nationally).
- On public transport, 19% of bus riders and 15% of train riders noticed a service improvement, against 7% nationally, with 4% of both bus and train riders noticing new public transport (compared to 2% nationally).
Fewer AA Members reported meaningful infrastructure improvements in 2026 than in 2025
A third (34%) of Members experienced an infrastructure improvement in the past year, down from 39% in 2025.

Every district except Hawke’s Bay saw a fall in Members noticing meaningful transport improvements in the past 12 months.
- Marlborough saw the largest fall, down 17 points to 29%.
- Otago (down 13 points to 25%), Bay of Plenty (down 11 points to 32%) and Northland (down 11 points to 30%) also fell significantly.
- Hawke’s Bay was the exception, rising from 38% to 42% – though this increase wasn't large enough to be statistically significant on its own.
What local transport infrastructure should be prioritised?
Smoother roads and fewer potholes is the single biggest transport priority for AA Members nationwide
We asked Members what three transport issues most need improving in their area.

Nearly half of Members (48%) picked smoother roads and fewer potholes – more than any other issue on the list, including safer roads and driver behaviour (43%) or less traffic congestion (39%).
In most districts, a majority of AA Members want road maintenance prioritised
When asked what needs improving most in their area, more Members picked road surface condition than anything else on the list.

- In Northland, more than 7 in 10 Members (72%) said smoother roads and fewer potholes is a top priority – the highest of any district. Northland Members experienced the highest rate of safety impacts due to poor road conditions, with 76% reporting at least one incident such as a near miss or vehicle damage.
- Taranaki (67%), South Canterbury (64%) and Southland (64%) also wanted more focus on improving road surface quality.
- More urban areas were less likely to see road maintenance as a priority – less than half of Auckland (38%), Otago (38%) and Nelson Members (39%) wanted smoother roads prioritised.
AA Members with high concerns about unsafe driving want more focus on safer roads and drivers
Safer roads and driver behaviour (such as speeding) is the second-highest priority nationally (43%). This tracks with how concerned districts are about unsafe drivers on the road, as well as what modes they use.

- Taranaki and Hawke's Bay have the highest demand for a focus on safer roads and drivers (50% each). Both also have above-average dissatisfaction with other drivers' behaviour (42% and 44%, against 38% nationally). Both districts have similar satisfaction rates with road layouts and speed limits; their concern seems to be linked to driver behaviour rather than roads per se.
- Northland also follows this pattern, with 48% wanting safer roads and drivers. This reflects both their high levels of dissatisfaction with the safety of drivers on the road (45%), as well as poor ratings of road safety factors across the board.
- Wellington has the lowest demand of any district (34%) and one of the lowest dissatisfaction rates with other drivers (30%).
- Bicycle riders, who are more exposed to other people's driving than most road users, are somewhat more likely to want this prioritised (47%) than the national average, while bus, train and e-scooter riders are somewhat less likely (35–39%).
Traffic congestion is a bigger concern in built-up districts than anywhere else
Congestion is the third-highest priority nationally (39%). Urban districts are much more likely to want a focus on reducing congestion and delays due to traffic.

- Auckland Members are by far the most likely to want congestion prioritised (52%), followed by Nelson (49%) and Bay of Plenty (45%) – and drivers in these kinds of areas are also the least satisfied with congestion itself, with just 28% of all drivers satisfied with congestion overall, one of the lowest scores for any aspect of car trips.
- Fewer than 1 in 10 Southland Members (9%) see congestion as a priority, likely reflecting how much less traffic there is to navigate.
Parking is a bigger priority for central city AA Members
Around a quarter (24%) of Members want easier or more affordable parking. Demand is significantly higher in more urban areas.

- Central city Members were more than twice as likely to want parking availability and affordability prioritised (36%) as rural Members (14%). Central city drivers were also the least satisfied with both parking availability (37%, against 52% rurally) and cost (21%, against 28% rurally).
- Otago has the strongest demand for better parking of any district (41%), with Wellington (33%) and Taranaki (32%) not far behind.
1 in 7 AA Members want safer walking routes prioritised nationally – notably more Northlanders want safe walkways prioritised
Fourteen percent of Members nationally say safer walking routes need improving. Northland is a clear exception, with 20% wanting more focus on safer walking routes.

- Rural Members report worse safety experiences than city walkers, but aren't more focused on fixing it – if anything, they are slightly less likely to want safer walking to be a priority (13%, against 18% in central city areas). This likely comes down to walking infrastructure being less common in rural areas in the first place, and rural Members simply walking less overall (42%, against 63% nationally).
- Northland breaks this pattern. It has the highest priority of any district (20%), likely due to its poor safety record for pedestrians across the board. For example, Northland had the lowest satisfaction for how well walking routes are designed for pedestrian safety (50% satisfied, against 59% nationally), as well as road crossing safety (51% satisfied, compared to 61% satisfied nationally).
Cyclists want safer routes due to the safety risks they face on the road
Members who cycle are far more likely to want safer cycling routes – over half of e-bike riders (52%) and 41% of bicycle riders want this as a focus, against just 19% of all Members.

Cyclists' strong desire for safer cycling routes tracks with their relatively high dissatisfaction with unsafe driving.
- Two out of five cyclists (42%) are dissatisfied with the safety of other road users' driving – a similar level of concern to drivers themselves (38% dissatisfied) – but the stakes are much higher for cyclists, who have far less protection if something goes wrong.
Just 22% feel safe cycling on roads with no dedicated cycle lane, compared with 43% on roads that have one – a gap that comes down entirely to whether a lane exists. Drivers and car passengers also see this as a gap; just 39% are satisfied with how well road layouts protect cyclists and pedestrians, and nearly a third (30%) are dissatisfied.
Where public transport works, AA Members want more of it
Where public transport meets Members' needs well, they use it more and want continued investment in it.

- Members who travel by bus or train are far more likely than average to want more frequent or reliable services prioritised (39% and 46%, against 26% nationally).
- Age matters just as much as which mode Members use – 40% of Members aged 18-34 want it prioritised, against just 17% of those aged 75 and over.
- Auckland and Wellington Members are more likely than average to want public transport improvements prioritised (31% and 34%, compared with 26% nationally). This isn't because they're dissatisfied with public transport – in fact, both districts record some of the highest satisfaction levels in the country. Instead, it reflects how heavily people use it.
- Nearly 3 in 10 Auckland Members caught a bus in the past four weeks and 13% used a train, while in Wellington 38% used a bus and 27% a train. That's well above the national averages of 20% and 8% respectively. Where public transport is widely used and generally works well, Members are more likely to see further investment as worthwhile. Wairarapa’s strong demand for improvement – the highest of any district at 47% – lines up closely with what Wairarapa's own train users experience: only 17% are satisfied with train frequency and 25% with punctuality, substantially lower than Auckland or Wellington train users (60–70% on both measures). This may help to explain why Wairarapa Members are focused on better public transport.
- In districts where public transport realistically isn't a viable option – Northland, North Otago and Southland among them – Members are more focused on the infrastructure they actually rely on, like roads, than on a service that isn't part of their daily life. Rural Members overall are less likely to want public transport prioritised (21%) than those in cities and towns (27–29%).
Where should improvements be prioritised?
AA Members think improvements are most needed for arterial roads, followed by state highways and residential streets
We asked Members where they think transport improvements are most needed, choosing up to three locations. Arterial roads came out on top nationally (51%), followed by state highways or motorways (34%) and residential streets (32%). Priorities vary considerably depending on where Members live.

- Arterial roads were a consistently high priority, selected by 52% of Members in central city and suburban areas and 51% of rural Members.
- Rural Members were much more likely to prioritise state highways or motorways (50%) than central-city Members (25%). Conversely, central-city and suburban Members were more likely than rural Members to prioritise residential streets (37% vs 17%) and town centres (29% vs 21%).
- Taranaki recorded the highest demand for state-highway or motorway improvements (62%), followed by South Canterbury (60%), Northland (55%), Wairarapa (53%) and Hawke’s Bay (52%).
- Bay of Plenty recorded the highest demand for arterial-road improvements (56%). Auckland and Taranaki followed at 55%, with Nelson at 53% and Canterbury at 52%.
About the AA State of Local Transport Survey 2026
The results in this report are based on responses from 8,336 AA Members who participated in the AA State of Local Transport 2026 survey. The survey was sent to a random sample of AA Members, including the members of the AA Member Voices Panel. A total of 163,748 AA Members were invited to participate, resulting in a 5.1% response rate. The maximum margin of error at the 95% confidence level is approximately ±1.1%. The survey was conducted between 29 April and 26 May 2026.
The survey explored AA Members' views on local transport across driving, walking, cycling and public transport, including road maintenance, road safety, and satisfaction with getting around their local area.
Results have been weighted to be representative of AA Membership by age, gender, and AA district. Percentages may not always add to 100% due to rounding.
See What AA Members think about local transport options and priorities for details about the 2025 survey.


These findings show that most AA Members haven’t noticed improvements to their local transport infrastructure in the past year, and fewer reported improvements than in 2025. Smoother roads and fewer potholes remain the top priority nationally, but what Members want fixed varies depending on where they live and how they travel – from state highways in rural areas, to public transport in Auckland and Wellington, and safer routes for Members who cycle.
The results help inform the AA's advocacy and policy positions, alongside research evidence, policy analysis, and input from AA District Councils across New Zealand. They also provide context for the AA's transport priorities and the issues Members believe require ongoing attention.
The AA State of Local Transport Survey covers a range of transport issues affecting AA Members.
Media contact and further information
- For media enquiries, please contact the AA Manager of Research, Safety & Communications Dylan Thomsen, +64 4 931 9991
- For information about the survey or further results, get in touch with our team at membervoices@aa.co.nz.
- Visit the AA Transport Surveys to find out more about the survey programme.